
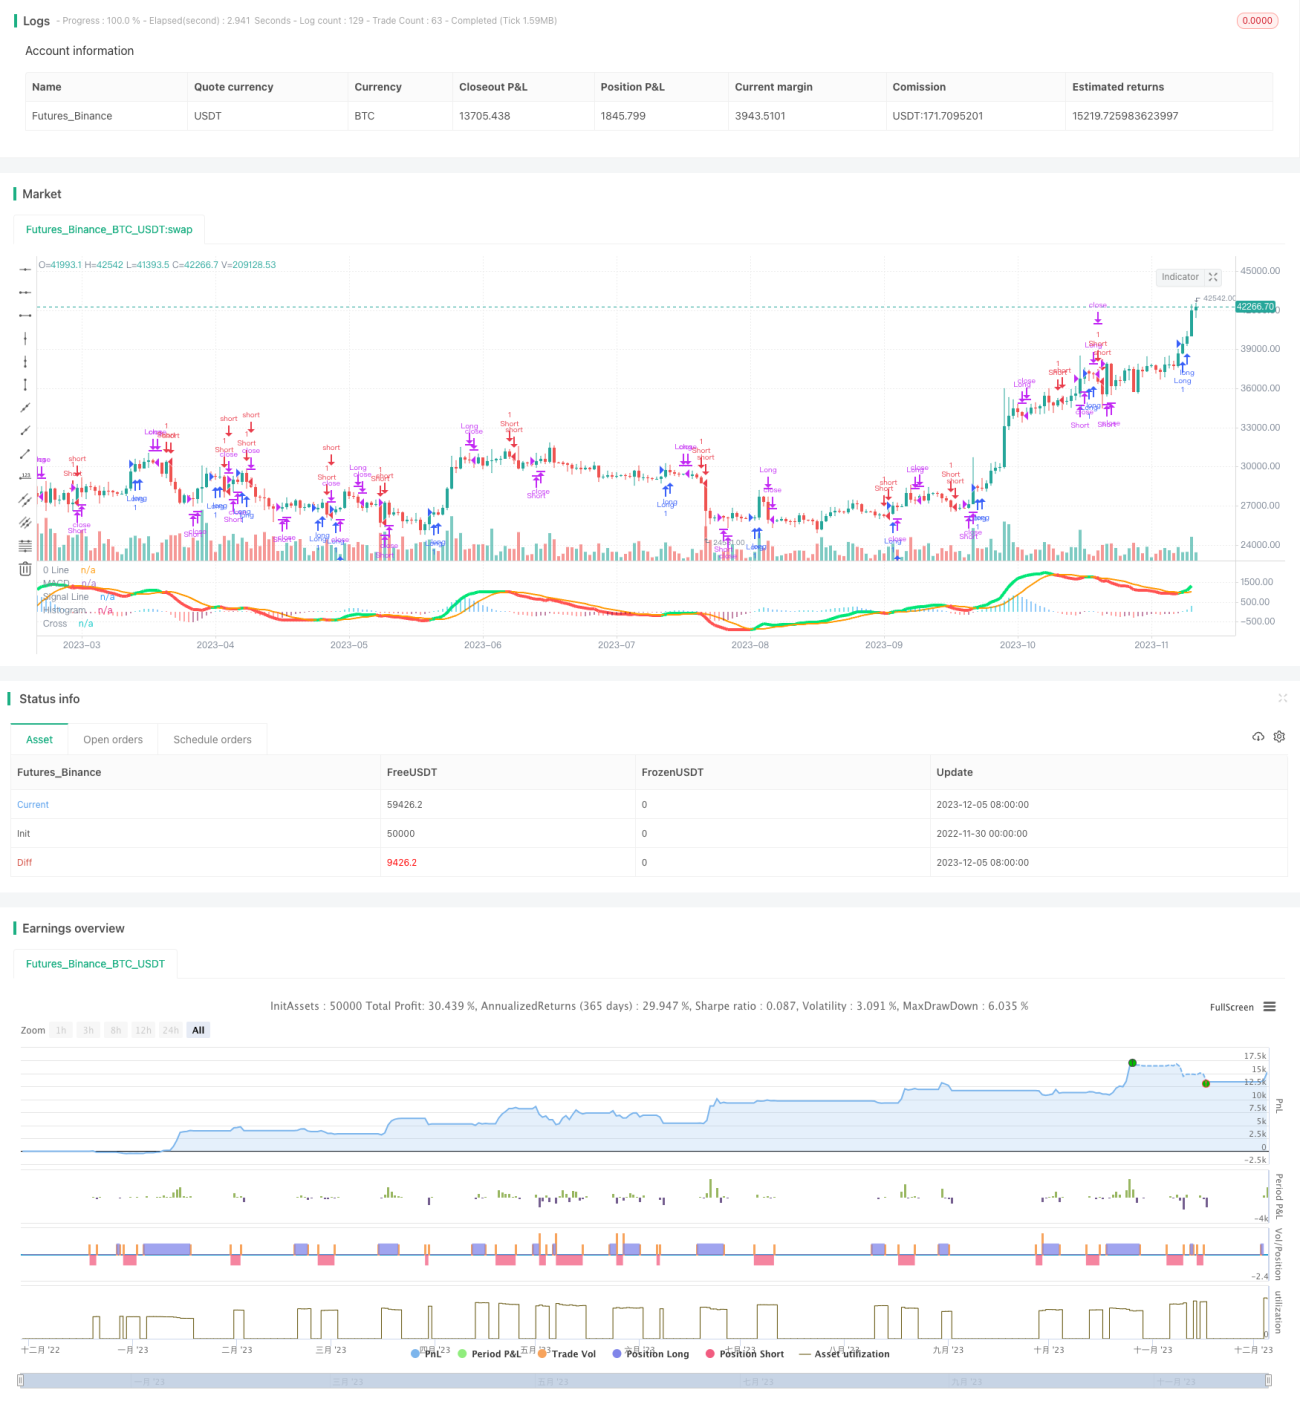
Die Strategie basiert auf dem MACD-Indikator, um eine zwei-Wege-Trading-Strategie zu realisieren. Sie kann auf dem MACD-Indikator bei Gold- und Todesforken überlegen und unterschlagen, und in Kombination mit anderen Indikator-Urteilen, um einige Signale zu filtern.
Die Strategie nutzt hauptsächlich MACD-Indikatoren, um einen Zwei-Wege-Handel zu realisieren. Insbesondere berechnet sie schnelle Moving Averages, langsame Moving Averages und MACD-Signallinien. Sie erzeugt ein Gold-Fork-Signal, wenn ein langsamer Moving Average über dem schnellen Moving Average durchquert wird.
Um einige ungültige Signale zu filtern, setzt die Strategie auch einen Bereich von ± 30 als Filter ein, der nur dann ein Handelssignal auslöst, wenn die MACD-Säulenlinie über diesen Bereich hinausgeht. Darüber hinaus wird die Richtung der MACD-Säulenlinie bei der Ausgleichslage beurteilt, die nur dann ausgeglichen wird, wenn sich die Richtung zweier aufeinanderfolgender Säulen ändert.
Diese Strategie ist im Großen und Ganzen eine grundsätzlich nutzbare Zwei-Wege-Trading-Strategie. Sie nutzt die Vorteile des MACD-Indikators und fügt gleichzeitig einige Filter hinzu, um die Qualität des Signals zu kontrollieren. Die MACD-Indikatoren selbst haben jedoch einige Probleme, die noch weiter getestet und optimiert werden müssen, um die Strategie in der Praxis zu verlässlichen.
]
/*backtest
start: 2022-11-30 00:00:00
end: 2023-12-06 00:00:00
period: 1d
basePeriod: 1h
exchanges: [{"eid":"Futures_Binance","currency":"BTC_USDT"}]
*/
//@version=3
//Created by user ChrisMoody updated 4-10-2014
//Regular MACD Indicator with Histogram that plots 4 Colors Based on Direction Above and Below the Zero Line
//Update allows Check Box Options, Show MacD & Signal Line, Show Change In color of MacD Line based on cross of Signal Line.
//Show Dots at Cross of MacD and Signal Line, Histogram can show 4 colors or 1, Turn on and off Histogram.
//Special Thanks to that incredible person in Tech Support whoem I won't say you r name so you don't get bombarded with emails
//Note the feature Tech Support showed me on how to set the default timeframe of the indicator to the chart Timeframe, but also allow you to choose a different timeframe.
//By the way I fully disclose that I completely STOLE the Dots at the MAcd Cross from "TheLark"
strategy("MACD Strategy", overlay=false)
// study(title="CM_MacD_Ult_MTF", shorttitle="CM_Ult_MacD_MTF")
source = close
useCurrentRes = input(true, title="Use Current Chart Resolution?")
resCustom = input(title="Use Different Timeframe? Uncheck Box Above", defval="60")
smd = input(true, title="Show MacD & Signal Line? Also Turn Off Dots Below")
sd = input(true, title="Show Dots When MacD Crosses Signal Line?")
sh = input(true, title="Show Histogram?")
macd_colorChange = input(true,title="Change MacD Line Color-Signal Line Cross?")
hist_colorChange = input(true,title="MacD Histogram 4 Colors?")
res = useCurrentRes ? timeframe.period : resCustom
fastLength = input(12, minval=1), slowLength=input(26,minval=1)
signalLength=input(9,minval=1)
fastMA = ema(source, fastLength)
slowMA = ema(source, slowLength)
macd = fastMA - slowMA
signal = sma(macd, signalLength)
hist = macd - signal
outMacD = request.security(syminfo.tickerid, res, macd)
outSignal = request.security(syminfo.tickerid, res, signal)
outHist = request.security(syminfo.tickerid, res, hist)
histA_IsUp = outHist > outHist[1] and outHist > 0
histA_IsDown = outHist < outHist[1] and outHist > 0
histB_IsDown = outHist < outHist[1] and outHist <= 0
histB_IsUp = outHist > outHist[1] and outHist <= 0
//MacD Color Definitions
macd_IsAbove = outMacD >= outSignal
macd_IsBelow = outMacD < outSignal
// strategy.entry("Long", strategy.long, 1, when = shouldPlaceLong)
// strategy.close("Long", shouldExitLong)
// strategy.entry("Short", strategy.short, 1, when = shouldPlaceShort)
// strategy.close("Short", shouldExitShort)
isWithinZeroMacd = outHist < 30 and outHist > -30
delta = hist
// shouldExitShort = false//crossover(delta, 0)
// shouldExitLong = false//crossunder(delta, 0)
// if(crossover(delta, 0))// and not isWithinZeroMacd)
// strategy.entry("Long", strategy.long, comment="Long")
// if (crossunder(delta, 0))// and not isWithinZeroMacd)
// strategy.entry("Short", strategy.short, comment="Short")
shouldPlaceLong = crossover(delta, 0)
strategy.entry("Long", strategy.long, 1, when = shouldPlaceLong)
shouldExitLong = not histA_IsUp and histA_IsDown
shouldExitShort = not histA_IsUp and not histA_IsDown and not histB_IsDown and histB_IsUp
shouldPlaceShort = crossunder(delta, 0)
strategy.entry("Short", strategy.short, 1, when = shouldPlaceShort)
// plot_color = gray
plot_color = if(hist_colorChange)
if(histA_IsUp)
aqua
else
if(histA_IsDown)
//need to sell
// if(not isWithinZeroMacd)
// shouldExitLong = true
// strategy.entry("Short", strategy.short, comment="Short")
blue
else
if(histB_IsDown)
red
else
if(histB_IsUp)
//need to buy
// if(not isWithinZeroMacd)
// shouldExitShort = true
// strategy.entry("Long", strategy.long, comment="Long")
maroon
else
yellow
else
gray
// plot_color = hist_colorChange ? histA_IsUp ? aqua : histA_IsDown ? blue : histB_IsDown ? red : histB_IsUp ? maroon :yellow :gray
macd_color = macd_colorChange ? macd_IsAbove ? lime : red : red
signal_color = macd_colorChange ? macd_IsAbove ? orange : orange : lime
circleYPosition = outSignal
plot(smd and outMacD ? outMacD : na, title="MACD", color=macd_color, linewidth=4)
plot(smd and outSignal ? outSignal : na, title="Signal Line", color=signal_color, style=line ,linewidth=2)
plot(sh and outHist ? outHist : na, title="Histogram", color=plot_color, style=histogram, linewidth=4)
plot(sd and cross(outMacD, outSignal) ? circleYPosition : na, title="Cross", style=circles, linewidth=4, color=macd_color)
// plot( isWithinZeroMacd ? outHist : na, title="CheckSmallHistBars", style=circles, linewidth=4, color=black)
hline(0, '0 Line', linewidth=2, color=white)
strategy.close("Short", shouldExitShort)
strategy.close("Long", shouldExitLong)
// fastLength = input(12)
// slowlength = input(26)
// MACDLength = input(9)
// MACD = ema(close, fastLength) - ema(close, slowlength)
// aMACD = ema(MACD, MACDLength)
// delta = MACD - aMACD
// if (crossover(delta, 0))
// strategy.entry("MacdLE", strategy.long, comment="MacdLE")
//if last two macd bars are higher than current, close long position
// if (crossunder(delta, 0))
// strategy.entry("MacdSE", strategy.short, comment="MacdSE")
//if last two macd bars are higher than current, close long position
// plot(strategy.equity, title="equity", color=red, linewidth=2, style=areabr)