
Die Dual Direction Price Breakthrough Moving Average Timing Trading Strategy ist eine quantitative Trading-Strategie, bei der der Preis durch den Durchschnittswert überschritten wird, um zu beurteilen, wann es Zeit ist, zu kaufen oder zu verkaufen. Die Strategie vergleicht die Preise mit den Moving Averages der angegebenen Perioden und erzeugt Handelssignale, je nachdem, ob die Preise den Durchschnittswert überschreiten oder überschreiten.
Die Kernlogik der Strategie lautet:
Die EMA-Funktion berechnet den Moving Average für einen bestimmten Zeitraum (z. B. 200 Tage).
Vergleichen Sie die Größenverhältnisse zwischen dem Schlusskurs und der EMA, um zu beurteilen, ob der Preis die EMA überschritten hat. Insbesondere wird der Preis als höher angesehen, wenn der Schlusskurs am Tag größer als die EMA ist; wenn der Schlusskurs am Tag kleiner als die EMA ist, wird der Preis als niedriger angesehen.
Beurteilen Sie die Kauf- und Verkaufszeiten anhand von Auf- und Abwärtsbewegungen. Wenn der Preis eine EMA überschreitet, wird ein Kaufsignal erzeugt; wenn der Preis eine EMA unterschreitet, wird ein Verkaufsignal erzeugt.
Beim Erstellen des Signals wird in einem bestimmten Prozentsatz (wie z. B. bei voller Lagerhaltung) bestellt und dann ein Stop-Loss- und ein Stop-Stop-Preis festgelegt.
Wenn der Preis den Stop-Loss- oder Stop-Stop-Preis erreicht, wird die Position ausgeglichen.
Die Zyklen nutzen die Zeit, die der Preis für die Durchschnittsbrechung hat, um zu profitieren.
Die Strategie ist einfach, direkt, leicht zu verstehen und umzusetzen. Durch die Erfassung von Durchbruchsignalen auf kurzen Linien wird eine bessere Timing erreicht. Es besteht jedoch ein gewisses Risiko für Verzögerungen und mehrere Erschütterungen.
Die Optimierung kann durch Parameteranpassungen erfolgen, z. B. durch die Anpassung der Durchschnittsparameter, die Verwendung effizienterer Indikatoren, die Verringerung der Handelsfrequenz usw. Die Risiken können auch durch die Einführung von Adaptive Stop Loss oder die Einführung von Filterbedingungen kontrolliert werden.
Die Strategie ist insgesamt relativ einfach und intuitiv. Die Kernidee besteht darin, kurzfristige Durchbrüche zu verfolgen, um die Preise zu erfassen. Die Vorteile sind reaktionsschnell und leicht zu realisieren; die Nachteile sind Verzögerung und Langsamkeit.
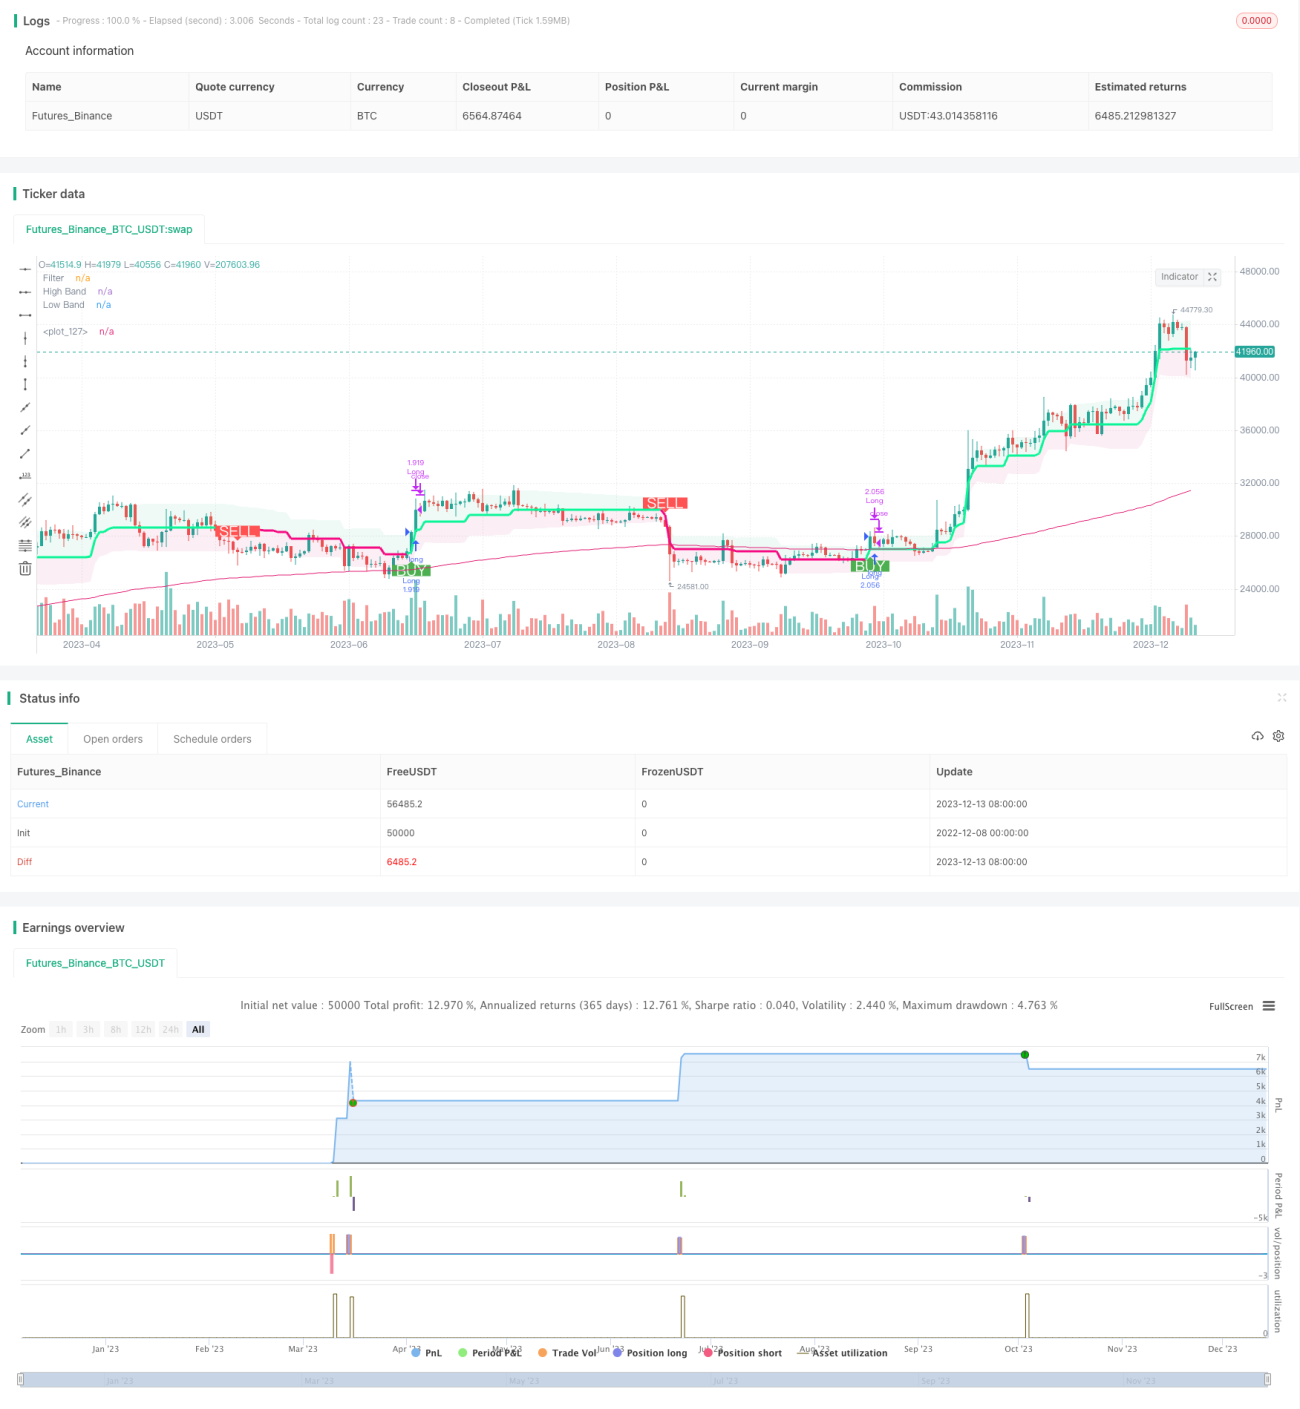
/*backtest
start: 2022-12-08 00:00:00
end: 2023-12-14 00:00:00
period: 1d
basePeriod: 1h
exchanges: [{"eid":"Futures_Binance","currency":"BTC_USDT"}]
*/
// This source code is subject to the terms of the Mozilla Public License 2.0 at https://mozilla.org/MPL/2.0/
// Credits to the original Script - Range Filter DonovanWall https://www.tradingview.com/script/lut7sBgG-Range-Filter-DW/
// This version is the old version of the Range Filter with less settings to tinker with
//@version=5
strategy(title='Range Filter - B&S Signals', shorttitle='RF - B&S Signals', initial_capital=1000, currency=currency.GBP, default_qty_value=100, default_qty_type=strategy.percent_of_equity, commission_type=strategy.commission.percent, commission_value=0.075, overlay=true)
i_startTime = input(defval=timestamp('01 Jan 2020 12:00 +0000'), title='Backtest Start')
i_endTime = input(defval=timestamp('01 Jan 2024 12:00 +0000'), title='Backtest End')
inDateRange = true
//-----------------------------------------------------------------------------------------------------------------------------------------------------------------
//Functions
//-----------------------------------------------------------------------------------------------------------------------------------------------------------------
longLossPerc = input.float(title='Long Stop Loss (%)', minval=0.0, step=0.1, defval=1) * 0.01
shortLossPerc = input.float(title='Short Stop Loss (%)', minval=0.0, step=0.1, defval=1) * 0.01
longTakePerc = input.float(title='Long Take(%)', minval=0.0, step=0.1, defval=1) * 0.01
shortTakePerc = input.float(title='Short Take (%)', minval=0.0, step=0.1, defval=1) * 0.01
emaLength = input.int(200, title="EMA Length")
// Determine stop loss price
//Range Size Function
rng_size(x, qty, n) =>
// AC = Cond_EMA(abs(x - x[1]), 1, n)
wper = n * 2 - 1
avrng = ta.ema(math.abs(x - x[1]), n)
AC = ta.ema(avrng, wper) * qty
rng_size = AC
rng_size
//Range Filter Function
rng_filt(x, rng_, n) =>
r = rng_
var rfilt = array.new_float(2, x)
array.set(rfilt, 1, array.get(rfilt, 0))
if x - r > array.get(rfilt, 1)
array.set(rfilt, 0, x - r)
if x + r < array.get(rfilt, 1)
array.set(rfilt, 0, x + r)
rng_filt1 = array.get(rfilt, 0)
hi_band = rng_filt1 + r
lo_band = rng_filt1 - r
rng_filt = rng_filt1
[hi_band, lo_band, rng_filt]
//-----------------------------------------------------------------------------------------------------------------------------------------------------------------
//Inputs
//-----------------------------------------------------------------------------------------------------------------------------------------------------------------
//Range Source
rng_src = input(defval=close, title='Swing Source')
//Range Period
rng_per = input.int(defval=20, minval=1, title='Swing Period')
//Range Size Inputs
rng_qty = input.float(defval=3.5, minval=0.0000001, title='Swing Multiplier')
//Bar Colors
use_barcolor = input(defval=false, title='Bar Colors On/Off')
//-----------------------------------------------------------------------------------------------------------------------------------------------------------------
//Definitions
//-----------------------------------------------------------------------------------------------------------------------------------------------------------------
//Range Filter Values
[h_band, l_band, filt] = rng_filt(rng_src, rng_size(rng_src, rng_qty, rng_per), rng_per)
//Direction Conditions
var fdir = 0.0
fdir := filt > filt[1] ? 1 : filt < filt[1] ? -1 : fdir
upward = fdir == 1 ? 1 : 0
downward = fdir == -1 ? 1 : 0
//Trading Condition
longCond = rng_src > filt and rng_src > rng_src[1] and upward > 0 or rng_src > filt and rng_src < rng_src[1] and upward > 0
shortCond = rng_src < filt and rng_src < rng_src[1] and downward > 0 or rng_src < filt and rng_src > rng_src[1] and downward > 0
CondIni = 0
CondIni := longCond ? 1 : shortCond ? -1 : CondIni[1]
longCondition = longCond and CondIni[1] == -1
shortCondition = shortCond and CondIni[1] == 1
//Colors
filt_color = upward ? #05ff9b : downward ? #ff0583 : #cccccc
bar_color = upward and rng_src > filt ? rng_src > rng_src[1] ? #05ff9b : #00b36b : downward and rng_src < filt ? rng_src < rng_src[1] ? #ff0583 : #b8005d : #cccccc
ema = ta.ema(close,emaLength)
//-----------------------------------------------------------------------------------------------------------------------------------------------------------------
//Outputs
//-----------------------------------------------------------------------------------------------------------------------------------------------------------------
longStopPrice = strategy.position_avg_price * (1 - longLossPerc)
shortStopPrice = strategy.position_avg_price * (1 + shortLossPerc)
longTakePrice = strategy.position_avg_price * (1 + longTakePerc)
shortTakePrice = strategy.position_avg_price * (1 - shortTakePerc)
//Filter Plot
filt_plot = plot(filt, color=filt_color, linewidth=3, title='Filter', transp=67)
//Band Plots
h_band_plot = plot(h_band, color=color.new(#05ff9b, 100), title='High Band')
l_band_plot = plot(l_band, color=color.new(#ff0583, 100), title='Low Band')
//Band Fills
fill(h_band_plot, filt_plot, color=color.new(#00b36b, 92), title='High Band Fill')
fill(l_band_plot, filt_plot, color=color.new(#b8005d, 92), title='Low Band Fill')
//Bar Color
barcolor(use_barcolor ? bar_color : na)
if inDateRange and close>ema
strategy.entry("Long", strategy.long, when=longCondition)
if inDateRange and close<ema
strategy.entry("Short", strategy.short, when=shortCondition)
plot(ema)
//Plot Buy and Sell Labels
plotshape(longCondition, title='Buy Signal', text='BUY', textcolor=color.white, style=shape.labelup, size=size.normal, location=location.belowbar, color=color.new(color.green, 0))
plotshape(shortCondition, title='Sell Signal', text='SELL', textcolor=color.white, style=shape.labeldown, size=size.normal, location=location.abovebar, color=color.new(color.red, 0))
//Alerts
alertcondition(longCondition, title='Buy Alert', message='BUY')
alertcondition(shortCondition, title='Sell Alert', message='SELL')
if strategy.position_size > 0
strategy.exit(id='Long', stop=longStopPrice, limit=longTakePrice)
if strategy.position_size < 0
strategy.exit(id='Short', stop=shortStopPrice, limit=shortTakePrice)