Bullish Engulfing Kauf- und Verkaufsstrategie
Überblick
Die Bullish Engulfing-Kauf- und Verkaufsstrategie ist eine quantitative Handelsstrategie, die auf K-Linienformationen basiert. Die Strategie nutzt die Gelegenheit, einen Kurswechsel zu erfassen, indem sie die K-Linienformationen von Bullish Engulfing identifiziert und Gewinne erzielt.
Die wichtigsten Vorteile dieser Strategie sind:
- Identifizierung von Chancen für eine hohe Wahrscheinlichkeit einer Preisumkehr auf der Grundlage einer bewährten Theorie der technischen Analyse
- Ein einfaches, intuitives Handelssignal
- Risiken sind zu kontrollieren
Strategieprinzip
Die Strategie basiert auf dem Trend von Bullish Engulfing, bei dem die K-Linie von Yang Yang verschluckt wird, um eine Kursumkehr zu ermitteln.
Wenn eine K-Linie mit einem kleineren Wurf entsteht, der der nachfolgenden K-Linie folgt und die K-Linie vollständig verschlingt, und der Schlusskurs über dem Höchstwert der vorherigen K-Linie liegt, wenn die Aktie im Abwärtstrend ist, entsteht eine Bullish Engulfing-Grossal, die darauf hindeutet, dass eine Kursumkehr bevorsteht, und die Aktienpreise steigen.
Die Strategie eröffnet zusätzliche Positionen, wenn die Bullish Engulfing-Form erkannt wird, und setzt die Stop-Loss-Exit-Strategie mit einem Ziel von 1% Gewinn, 1% Verlust und Lockerung des Gewinns.
Strategische Stärkenanalyse
Diese Strategie hat folgende Vorteile:
- Basierend auf der etablierten Theorie der Technischen Analyse, ist der Bullish Engulfing Sonnenbruch ein hochprobabler Preiswechselsignal, der die Chance auf einen Preiswechsel effektiv erfasst.
- Das Trading-Signal ist einfach, intuitiv und leicht verständlich und eignet sich für quantitative Trading.
- Die Verwendung von hochliquiditätsfähigen Varianten wie Aktienindex-Futures ermöglicht effiziente Ein- und Ausgänge.
- Mit dem Stop Loss Exit können Sie die Gewinn- und Verlustquote für einzelne Geschäfte kontrollieren, um Gewinn- und Verlustresultate zu gewährleisten und große Verluste zu vermeiden.
- Die Strategieparameter können flexibel an verschiedene Sorten und Marktumgebungen angepasst werden.
Strategische Risikoanalyse
Die Strategie birgt auch einige Risiken:
- Aufgrund der Theorie der technischen Analyse besteht ein gewisses Risiko für Fehlsignale.
- Veränderungen der Marktbedingungen können dazu führen, dass die Parameter ausfallen und angepasst werden müssen.
- Eine zu geringe Stop-Loss-Einstellung kann zu einem geringen Stop-Loss führen, eine zu hohe kann zu einem erhöhten Verlust führen.
Wir können die folgenden Maßnahmen ergreifen, um diese Risiken zu bekämpfen:
- Optimierung von Parametern, um die Effektivität in verschiedenen Märkten zu überprüfen.
- Erhöhung der Stop-Loss-Grenze, um sicherzustellen, dass der Einzelschaden in einem erträglichen Bereich gehalten wird.
- Handelsarten mit hoher Liquidität und mittlerer Volatilität, wie z. B. Indizes oder Aktienindex-Futures.
Richtung der Strategieoptimierung
Die Strategie kann auch in folgenden Bereichen optimiert werden:
- In Kombination mit Trendindikator-Filtern, z. B. durch Einschaltung von Gewinn- und Verlust-Richtlinien, um einen negativen Handel zu vermeiden.
- Das ist eine gute Idee, um die Marge zu erhöhen und die Gewinnspanne zu erweitern.
- Optimierung von Stop-Loss-Mechanismen, z. B. die Möglichkeit, Stop-Loss-Werte zu erhöhen, um die Stop-Loss-Wahrscheinlichkeit zu verringern, wenn der Preis schrittweise steigt.
- Eine andere K-Linien-Form-Kombination, ähnlich wie die Bullish Engulfing-Kombination, wird verwendet, um eine Transaktions-Kombination zu bilden.
Zusammenfassen
Die Bullish Engulfing-Kauf- und Verkaufsstrategie ist eine bewährte, auf technischer Analyse basierende, quantitative Handelsstrategie mit Vorteilen wie Kurzfassung und Klarheit der Handelssignale und einfache Umsetzung. Bei Optimierung der Parameter und Risikokontrollmaßnahmen kann ein stabiler Gewinn erzielt werden, was empfehlenswert ist.
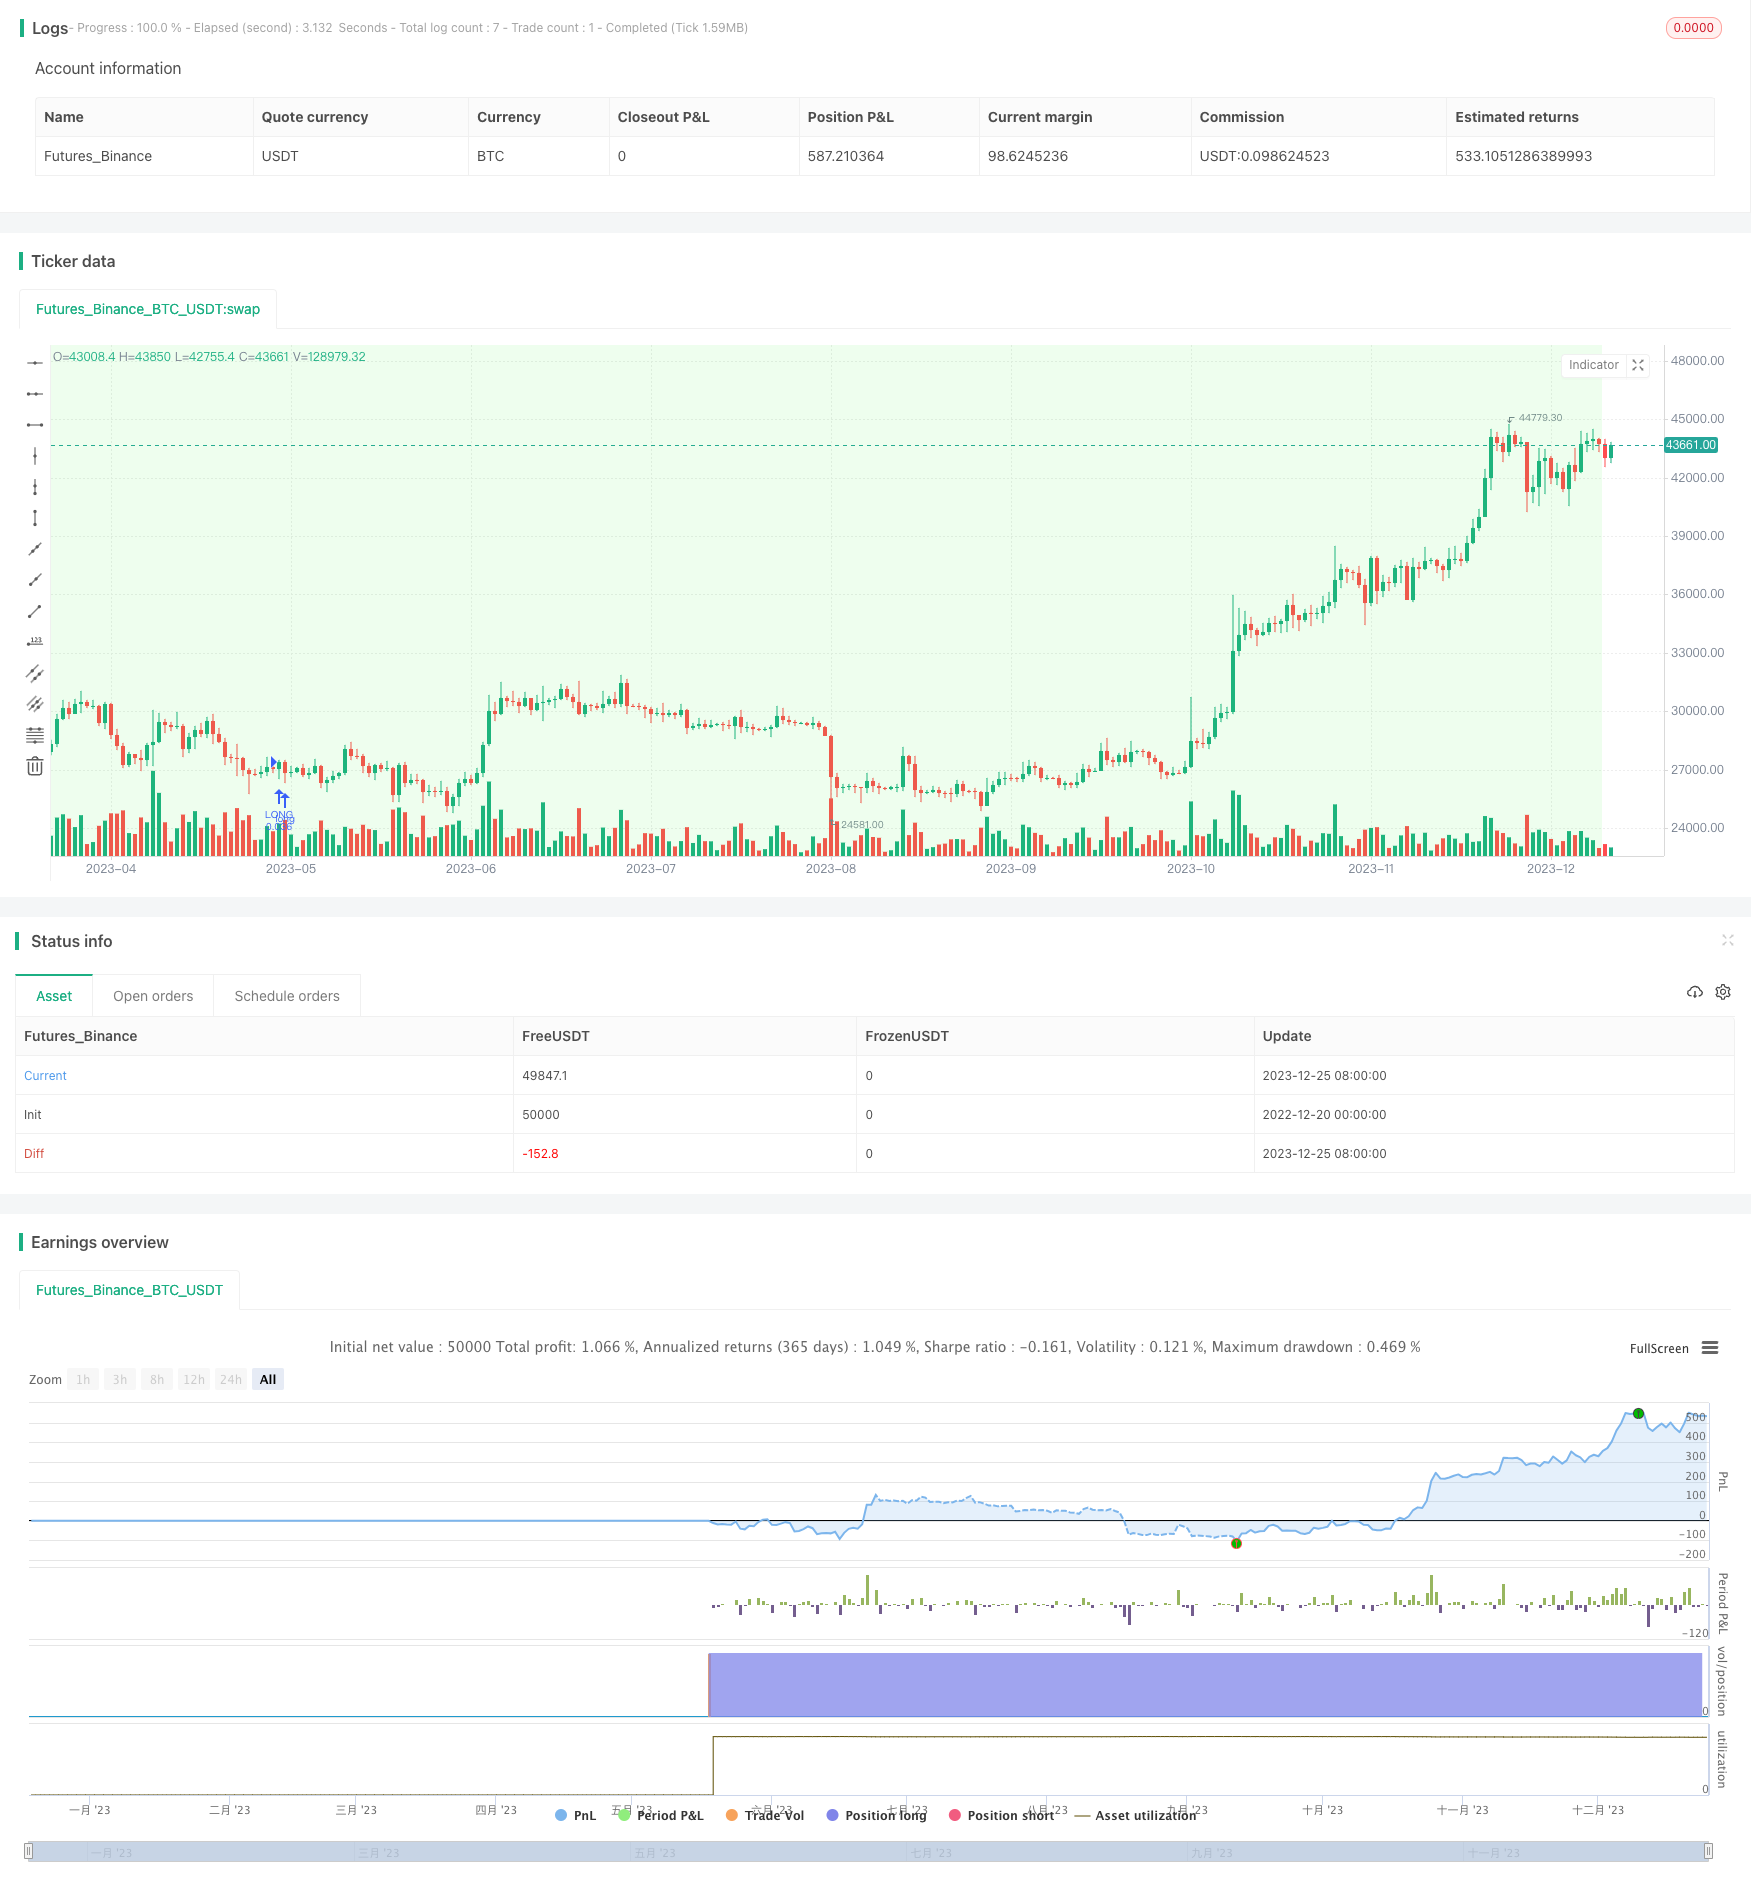
/*backtest
start: 2022-12-20 00:00:00
end: 2023-12-26 00:00:00
period: 1d
basePeriod: 1h
exchanges: [{"eid":"Futures_Binance","currency":"BTC_USDT"}]
*/

// This source code is subject to the terms of the Mozilla Public License 2.0 at https://mozilla.org/MPL/2.0/
// © thequantscience

// ██████╗ ██╗   ██╗██╗     ██╗     ██╗███████╗██╗  ██╗    ███████╗███╗   ██╗ ██████╗ ██╗   ██╗██╗     ███████╗██╗███╗   ██╗ ██████╗
// ██╔══██╗██║   ██║██║     ██║     ██║██╔════╝██║  ██║    ██╔════╝████╗  ██║██╔════╝ ██║   ██║██║     ██╔════╝██║████╗  ██║██╔════╝
// ██████╔╝██║   ██║██║     ██║     ██║███████╗███████║    █████╗  ██╔██╗ ██║██║  ███╗██║   ██║██║     █████╗  ██║██╔██╗ ██║██║  ███╗
// ██╔══██╗██║   ██║██║     ██║     ██║╚════██║██╔══██║    ██╔══╝  ██║╚██╗██║██║   ██║██║   ██║██║     ██╔══╝  ██║██║╚██╗██║██║   ██║
// ██████╔╝╚██████╔╝███████╗███████╗██║███████║██║  ██║    ███████╗██║ ╚████║╚██████╔╝╚██████╔╝███████╗██║     ██║██║ ╚████║╚██████╔╝
// ╚═════╝  ╚═════╝ ╚══════╝╚══════╝╚═╝╚══════╝╚═╝  ╚═╝    ╚══════╝╚═╝  ╚═══╝ ╚═════╝  ╚═════╝ ╚══════╝╚═╝     ╚═╝╚═╝  ╚═══╝ ╚═════╝

//@version=5
strategy(
     "Buy&Sell Bullish Engulfing - The Quant Science",
     overlay = true,
     default_qty_type = strategy.percent_of_equity,
     default_qty_value = 100,
     pyramiding = 1,
     currency = currency.EUR,
     initial_capital = 10000,
     commission_type = strategy.commission.percent,
     commission_value = 0.07,
     process_orders_on_close = true,
     close_entries_rule = "ANY"
     )

startDate  = input.int(title="D: ", defval=1,    minval=1,    maxval=31,   inline = 'Start', group = "START DATE BACKTESTING", tooltip = "D is Day, M is Month, Y is Year.")
startMonth = input.int(title="M: ", defval=1,    minval=1,    maxval=12,   inline = 'Start', group = "START DATE BACKTESTING", tooltip = "D is Day, M is Month, Y is Year.")
startYear  = input.int(title="Y: ", defval=2022, minval=1800, maxval=2100, inline = 'Start', group = "START DATE BACKTESTING", tooltip = "D is Day, M is Month, Y is Year.")

endDate    = input.int(title="D: ", defval=31,   minval=1,    maxval=31,   inline = 'End',   group = "END DATE BACKTESTING", tooltip = "D is Day, M is Month, Y is Year.")
endMonth   = input.int(title="M: ", defval=12,   minval=1,    maxval=12,   inline = 'End',   group = "END DATE BACKTESTING", tooltip = "D is Day, M is Month, Y is Year.")
endYear    = input.int(title="Y: ", defval=2023, minval=1800, maxval=2100, inline = 'End',   group = "END DATE BACKTESTING", tooltip = "D is Day, M is Month, Y is Year.")

inDateRange = (time >= timestamp(syminfo.timezone, startYear, startMonth, startDate, 0, 0)) and (time < timestamp(syminfo.timezone, endYear, endMonth, endDate, 0, 0))

PROFIT   = input.float(defval = 1, minval = 0, title = "Target profit (%): ", step = 0.10, group = "TAKE PROFIT-STOP LOSS")
STOPLOSS = input.float(defval = 1, minval = 0, title = "Stop Loss (%): ",     step = 0.10, group = "TAKE PROFIT-STOP LOSS")

var float equity_trades = 0
strategy.initial_capital = 50000
equity_trades := strategy.initial_capital
var float equity   = 0
var float qty_order   = 0
t_ordersize = "Percentage size of each new order. With 'Reinvestment Profit' activate, the size will be calculate on the equity, with 'Reinvestment Profit' deactivate the size will be calculate on the initial capital."
orders_size = input.float(defval = 2, title = "Orders size (%): ", minval = 0.10, step = 0.10,  maxval = 100, group = "RISK MANAGEMENT", tooltip = t_ordersize)
qty_order := ((equity_trades * orders_size) / 100 ) / close

C_DownTrend = true
C_UpTrend   = true
var trendRule1 = "SMA50"
var trendRule2 = "SMA50, SMA200"
var trendRule = input.string(trendRule1, "Detect Trend Based On", options=[trendRule1, trendRule2, "No detection"], group = "BULLISH ENGULFING")

if trendRule == trendRule1
	priceAvg = ta.sma(close, 50)
	C_DownTrend := close < priceAvg
	C_UpTrend := close > priceAvg

if trendRule == trendRule2
	sma200 = ta.sma(close, 200)
	sma50  = ta.sma(close, 50)
	C_DownTrend := close < sma50 and sma50 < sma200
	C_UpTrend := close > sma50 and sma50 > sma200
C_Len = 14
C_ShadowPercent = 5.0
C_ShadowEqualsPercent = 100.0
C_DojiBodyPercent = 5.0
C_Factor = 2.0

C_BodyHi = math.max(close, open)
C_BodyLo = math.min(close, open)
C_Body = C_BodyHi - C_BodyLo
C_BodyAvg = ta.ema(C_Body, C_Len)
C_SmallBody = C_Body < C_BodyAvg
C_LongBody = C_Body > C_BodyAvg
C_UpShadow = high - C_BodyHi
C_DnShadow = C_BodyLo - low
C_HasUpShadow = C_UpShadow > C_ShadowPercent / 100 * C_Body
C_HasDnShadow = C_DnShadow > C_ShadowPercent / 100 * C_Body
C_WhiteBody = open < close
C_BlackBody = open > close
C_Range = high-low
C_IsInsideBar = C_BodyHi[1] > C_BodyHi and C_BodyLo[1] < C_BodyLo
C_BodyMiddle = C_Body / 2 + C_BodyLo
C_ShadowEquals = C_UpShadow == C_DnShadow or (math.abs(C_UpShadow - C_DnShadow) / C_DnShadow * 100) < C_ShadowEqualsPercent and (math.abs(C_DnShadow - C_UpShadow) / C_UpShadow * 100) < C_ShadowEqualsPercent
C_IsDojiBody = C_Range > 0 and C_Body <= C_Range * C_DojiBodyPercent / 100
C_Doji = C_IsDojiBody and C_ShadowEquals

patternLabelPosLow  = low  - (ta.atr(30) * 0.6)
patternLabelPosHigh = high + (ta.atr(30) * 0.6)

label_color_bullish = input.color(color.rgb(43, 255, 0), title = "Label Color Bullish", group = "BULLISH ENGULFING")
C_EngulfingBullishNumberOfCandles = 2
C_EngulfingBullish = C_DownTrend and C_WhiteBody and C_LongBody and C_BlackBody[1] and C_SmallBody[1] and close >= open[1] and open <= close[1] and ( close > open[1] or open < close[1] )
if C_EngulfingBullish
    var ttBullishEngulfing = "Engulfing\nAt the end of a given downward trend, there will most likely be a reversal pattern. To distinguish the first day, this candlestick pattern uses a small body, followed by a day where the candle body fully overtakes the body from the day before, and closes in the trend’s opposite direction. Although similar to the outside reversal chart pattern, it is not essential for this pattern to completely overtake the range (high to low), rather only the open and the close."
    label.new(bar_index, patternLabelPosLow, text="BE", style=label.style_label_up, color = label_color_bullish, textcolor=color.white, tooltip = ttBullishEngulfing)
bgcolor(ta.highest(C_EngulfingBullish?1:0, C_EngulfingBullishNumberOfCandles)!=0 ? color.new(#21f321, 90) : na, offset=-(C_EngulfingBullishNumberOfCandles-1))

var float c       = 0
var float o       = 0
var float c_exit  = 0
var float c_stopl = 0

if C_EngulfingBullish and strategy.opentrades==0 and inDateRange
    c := strategy.equity
    o := close
    c_exit  := c + (c * PROFIT / 100)
    c_stopl := c - (c * STOPLOSS / 100)
    strategy.entry(id = "LONG", direction = strategy.long, qty = qty_order, limit = o)

if ta.crossover(strategy.equity, c_exit)
    strategy.exit(id = "CLOSE-LONG", from_entry = "LONG", limit = close)
if ta.crossunder(strategy.equity, c_stopl)
    strategy.exit(id = "CLOSE-LONG", from_entry = "LONG", limit = close)