Breakout-Following-Strategie

Überblick
Die Hauptidee dieser Strategie ist es, die Richtung der Trends auf den größeren Zeitrahmen zu identifizieren und auf den kleineren Zeitrahmen die Eintrittspunkte zu finden, während der Stopp-Exit den Moving Averages auf den größeren Zeitrahmen verfolgt.
Strategieprinzip
Die Strategie basiert auf drei Indikatoren:
Zuerst berechnet man einen X-Tage-Simple Moving Average für eine längere Periode (z.B. eine Sonnenlinie), der nur dann zum Kauf zugelassen ist, wenn der Moving Average auf der Preisstation steht. Dies kann verwendet werden, um die Richtung des allgemeinen Trends zu bestimmen und eine Periode der Handelsschwankungen zu vermeiden.
Zweitens berechnet man die höchsten Preise innerhalb eines kürzeren Zeitraums (z.B. 5 Tage), um ein Kaufsignal auszulösen, wenn der Preis diesen Höchstwert überschreitet. Hier wird ein Rückblick auf die Periodiparameter lb kombiniert, um einen geeigneten Bruchpunkt zu finden.
Drittens, eine Stop-Line zu erstellen. Nach dem Eintritt in die Position, die Stop-Line auf den niedrigsten Preis von lbStop in einem bestimmten Zeitraum von der nächsten Tiefe gesperrt. Gleichzeitig ein Moving Average (wie die 10-Tage-EMA der Tageslinie) als Exit-Mechanismus, der den Handel aus dem Handel, wenn der Preis unter dem Moving Average.
Die Strategie setzt gleichzeitig den ATR-Wert ein, um zu vermeiden, dass überhöhte Punkte gekauft werden. Zusätzlich gibt es weitere zusätzliche Bedingungen wie die Rückmesszeit.
Die Interaktionen dieser drei Indikatoren bilden die zentrale Logik der Strategie.
Strategische Stärkenanalyse
Es handelt sich um eine bahnbrechende Tracking-Strategie mit folgenden Vorteilen:
-
Verwenden Sie zwei Zeitrahmen, um zu vermeiden, dass Sie in einem wackligen Markt mit falschen Durchbrüchen gefangen sind. Die längeren Zeitrahmen beurteilen die allgemeinen Trends, die kürzeren suchen nach bestimmten Einstiegspunkten.
-
Durchschnittspunkte, die durch Swing Highs entstehen, sind inertial und leicht nachvollziehbar. Die Parameter lb können angepasst werden, um nach wirklich effektiven Durchbrüchen zu suchen.
-
Die Stop-Loss-Methode ist strenger und verfolgt die jüngsten Tiefststände und lässt eine gewisse Bufferdistanz zu, um zu vermeiden, dass sie aufgehängt werden.
-
Die Verwendung von Moving Averages als Exit-Mechanismus ermöglicht eine flexible Einstellung.
-
Die ATR-Anzeige verhindert die Gefahr einer Überstrahlung.
-
Es können verschiedene Parameterkombinationen eingestellt werden, um die Wirkung zu testen und zu optimieren.
Risikoanalyse
Die Strategie birgt auch Risiken:
-
Wenn die Preise in der Nähe des Moving Averages auf und ab schwanken, ist es leicht, wiederholt in und aus der Position zu wechseln. Dies birgt das Risiko höherer Gebühren.
-
Wenn der Kaufpunkt in der Nähe des beweglichen Durchschnitts durchbrochen wird, besteht ein höheres Rücknahmerisiko. Dies ist eine Eigenschaft der Strategie selbst.
-
Wenn die Marktentwicklung sich nicht deutlich entwickelt, kann es zu lange dauern, und es besteht ein Zeitrisiko.
-
Es ist notwendig, die ATR-Parameter vernünftigerweise einzustellen. Wenn der ATR zu klein ist, ist die Filterwirkung schwach, wenn er zu groß ist, verringert sich die Eintrittschancen.
-
Es ist notwendig, die Auswirkungen verschiedener lb-Parameter auf die Ergebnisse zu testen. Zu große Parameter verpassen einige Chancen, zu kleine Parameter können falsche Durchbrüche erkennen.
Die Risiken können auf folgende Weise gelöst werden:
- Die Moving Average-Parameter wurden entsprechend angepasst, um die Filterfunktion zu erhöhen.
- Optimierung der ATR-Parameter und visuelle Beurteilung
- Anpassung an die Periode lb, um die optimale Parameter zu finden.
- Die Banken haben ihre Geschäfte unter dem Sturm ausgesetzt.
Richtung der Strategieoptimierung
Die Strategie kann auch in folgenden Dimensionen optimiert werden:
-
Verschiedene Kombinationen von Moving Average-Parametern werden getestet, um die optimale Variante zu finden.
-
Versuchen Sie, verschiedene ATR-Parameter einzustellen, um die Eintrittschancen und die Risikokontrolle auszugleichen.
-
Optimierung der Rückblick-Periode lb-Parameter zur Identifizierung effizienterer Durchbrüche.
-
Versuchen Sie, dynamische Stop-Losses zu erstellen, um die Risiken aufgrund der Volatilität und der Rücknahme zu kontrollieren.
-
Die Effektivität des Durchbruchs wird in Kombination mit anderen Faktoren, wie beispielsweise dem Handelsvolumen, beurteilt.
-
Entwicklung von Methoden zur Suche nach Extreme als Referenzpunkte, wie z.B. >/',</,><
-
Versuchen Sie, die Parameter mit Machine Learning zu trainieren, um die optimalen Parameter zu erhalten
Zusammenfassen
Die Strategie als Ganzes ist eine typische Breakthrough-Tracking-Strategie. Die Doppel-Zeitrahmen-Beschlüsse, die Swing High-Erkennung der Einstiegsmomente, die Stop-Line und die Doppel-Exit-Mechanismen des Moving Averages bilden ein vollständiges logisches System. Die Strategie weist eine eindeutige Risiko- und Ertragscharakteristik und ist für Investoren geeignet, die die Art von mittleren und langen Linien verfolgen.
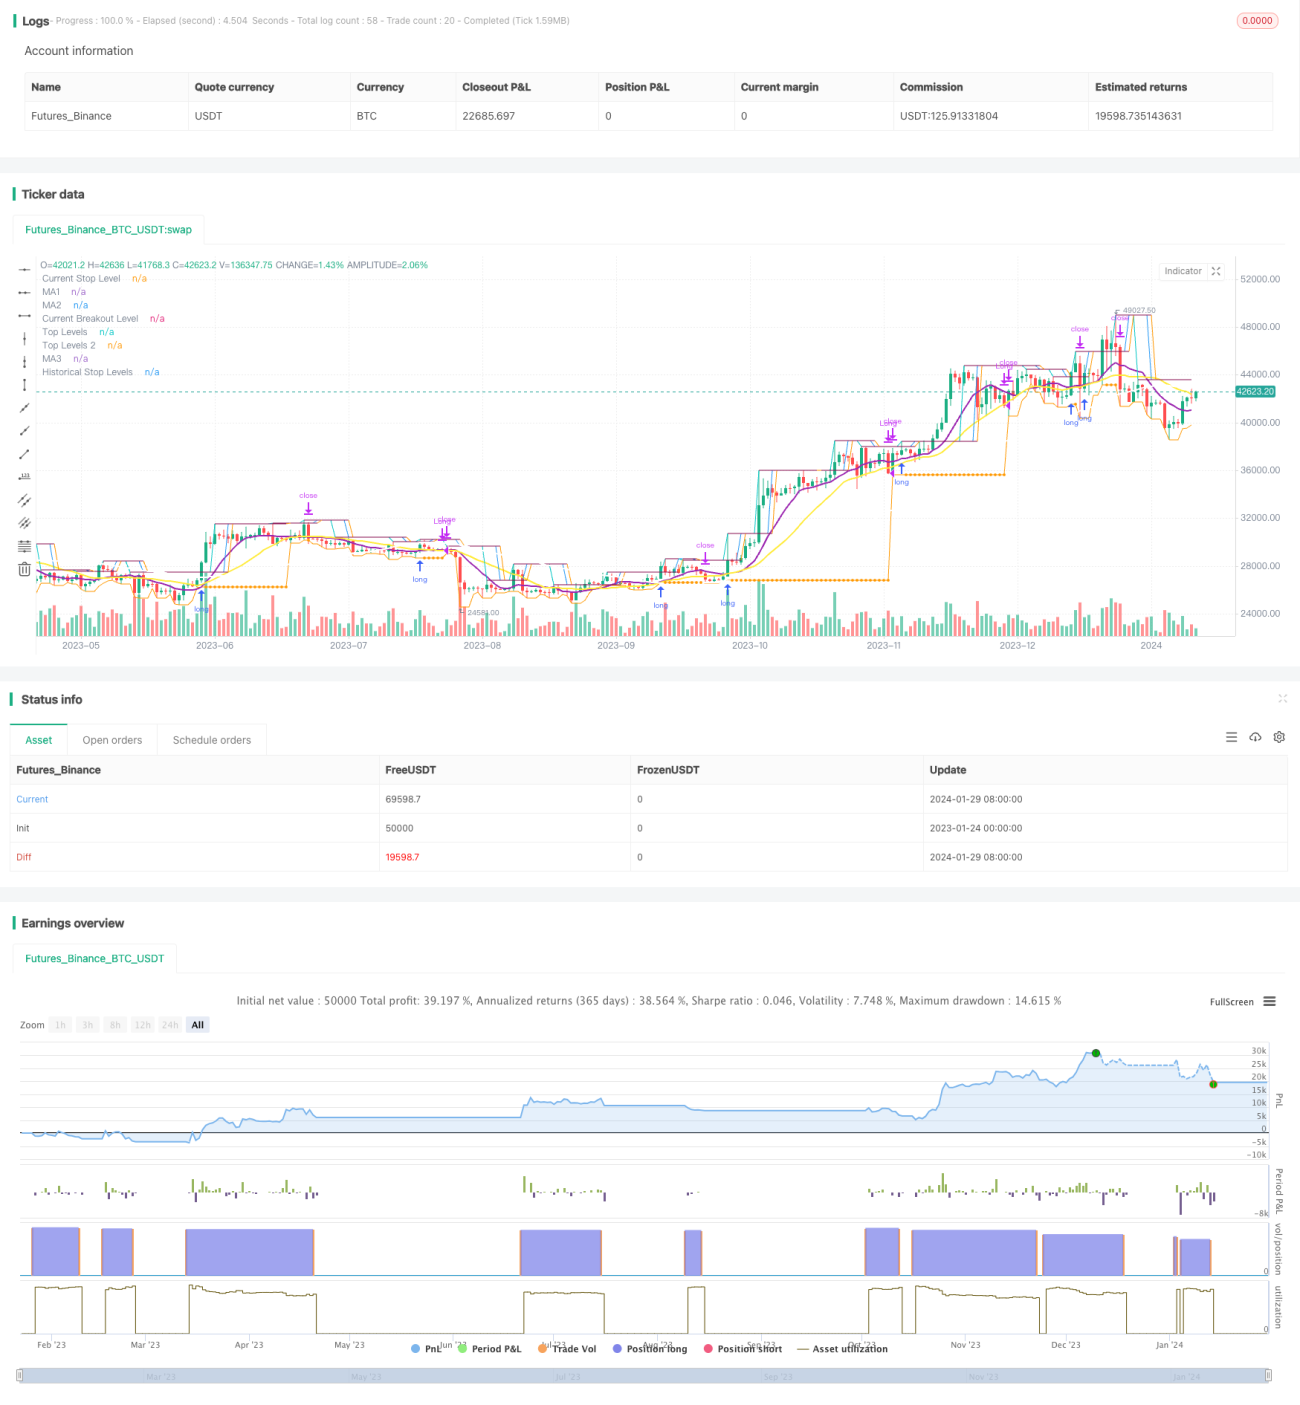
/*backtest
start: 2023-01-24 00:00:00
end: 2024-01-30 00:00:00
period: 1d
basePeriod: 1h
exchanges: [{"eid":"Futures_Binance","currency":"BTC_USDT"}]
*/

// This source code is subject to the terms of the Mozilla Public License 2.0 at https://mozilla.org/MPL/2.0/
// © millerrh

// The intent of this strategy is to buy breakouts with a tight stop on smaller timeframes in the direction of the longer term trend.- 1