Estrategia comercial para cuando el precio rompe la media móvil

Descripción general
La estrategia de negociación de brecha de precio de doble dirección (en inglés: Dual Direction Price Breakthrough Moving Average Timing Trading Strategy) es una estrategia de negociación cuantitativa que utiliza la brecha de precio de la media para determinar el momento de comprar o vender. La estrategia utiliza la comparación de los precios con las medias móviles de un período determinado para generar una señal de negociación en función de si el precio sube o baja la media.
Principio de estrategia
La lógica central de esta estrategia es la siguiente:
-
Utiliza la función EMA para calcular el promedio móvil de un período determinado (por ejemplo, 200 días).
-
Compara la relación entre el precio de cierre y la magnitud de la EMA para determinar si el precio ha roto la EMA. En concreto, se considera que el precio está por encima de la EMA cuando el precio de cierre es mayor que la EMA en el día; se considera que el precio está por debajo de la EMA cuando el precio de cierre es menor que la EMA en el día.
-
Cuando el precio está por encima del EMA, se genera una señal de compra; cuando el precio está por debajo del EMA, se genera una señal de venta.
-
Al generar la señal, ponga una orden en una proporción determinada (por ejemplo, en el almacén completo) y luego establezca un precio de stop loss y un precio de parada.
-
Cuando el precio alcanza el precio de stop loss o stop-loss, aplanar la posición.
-
En este ciclo, se aprovecha la oportunidad de los precios de romper la línea media para sacar provecho.
La estrategia es sencilla, directa, fácil de entender y de implementar. Se obtiene una mejor puntualidad por la captura de señales de ruptura en líneas cortas. Pero también existe un cierto retraso y el riesgo de múltiples temblores.
Ventajas estratégicas
- La lógica de la estrategia es simple, clara, fácil de entender y verificar.
- Utilizando la característica de la línea media, hay una cierta capacidad de seguimiento de tendencias.
- El número de transacciones es alto y es adecuado para operaciones de línea corta.
- La respuesta rápida a los cambios de precio y la mejor manera de capturar el momento.
Riesgo estratégico
- Hay un cierto retraso que puede hacer que se pierda el primer avance.
- El problema de las transacciones frecuentes es que las rupturas son frecuentes.
- En el caso de una reversión significativa, el stop loss puede ser cubierto.
Se puede optimizar a través de ajustes de parámetros, como ajustar los parámetros de la línea media, usar un juicio de indicadores más eficiente, reducir la frecuencia de las transacciones, etc. También se puede configurar un stop loss adaptativo o introducir condiciones de filtración para controlar el riesgo.
Dirección de optimización de la estrategia
- Prueba diferentes tipos de medias y parámetros para encontrar mejores soluciones, como EMA, SMA, LWMA, etc.
- Se han añadido condiciones de filtración para evitar múltiples transacciones convulsivas. Se han introducido juzgamientos auxiliares, como el volumen de transacción, la línea de Brin y el ATR.
- Optimización y prueba de estrategias de detención de pérdidas para reducir el riesgo.
- El sistema de negociación integrado, que combina varias estrategias, como la tendencia y la reversión.
- La configuración de parámetros se ha añadido para que la estrategia sea más universal.
Resumir
La estrategia en su conjunto es simple e intuitiva, y la idea central es seguir la línea de medianía para capturar brechas a corto plazo en los precios. La ventaja es la agilidad de la reacción y la facilidad de implementación; la desventaja es el atraso y la lentitud.
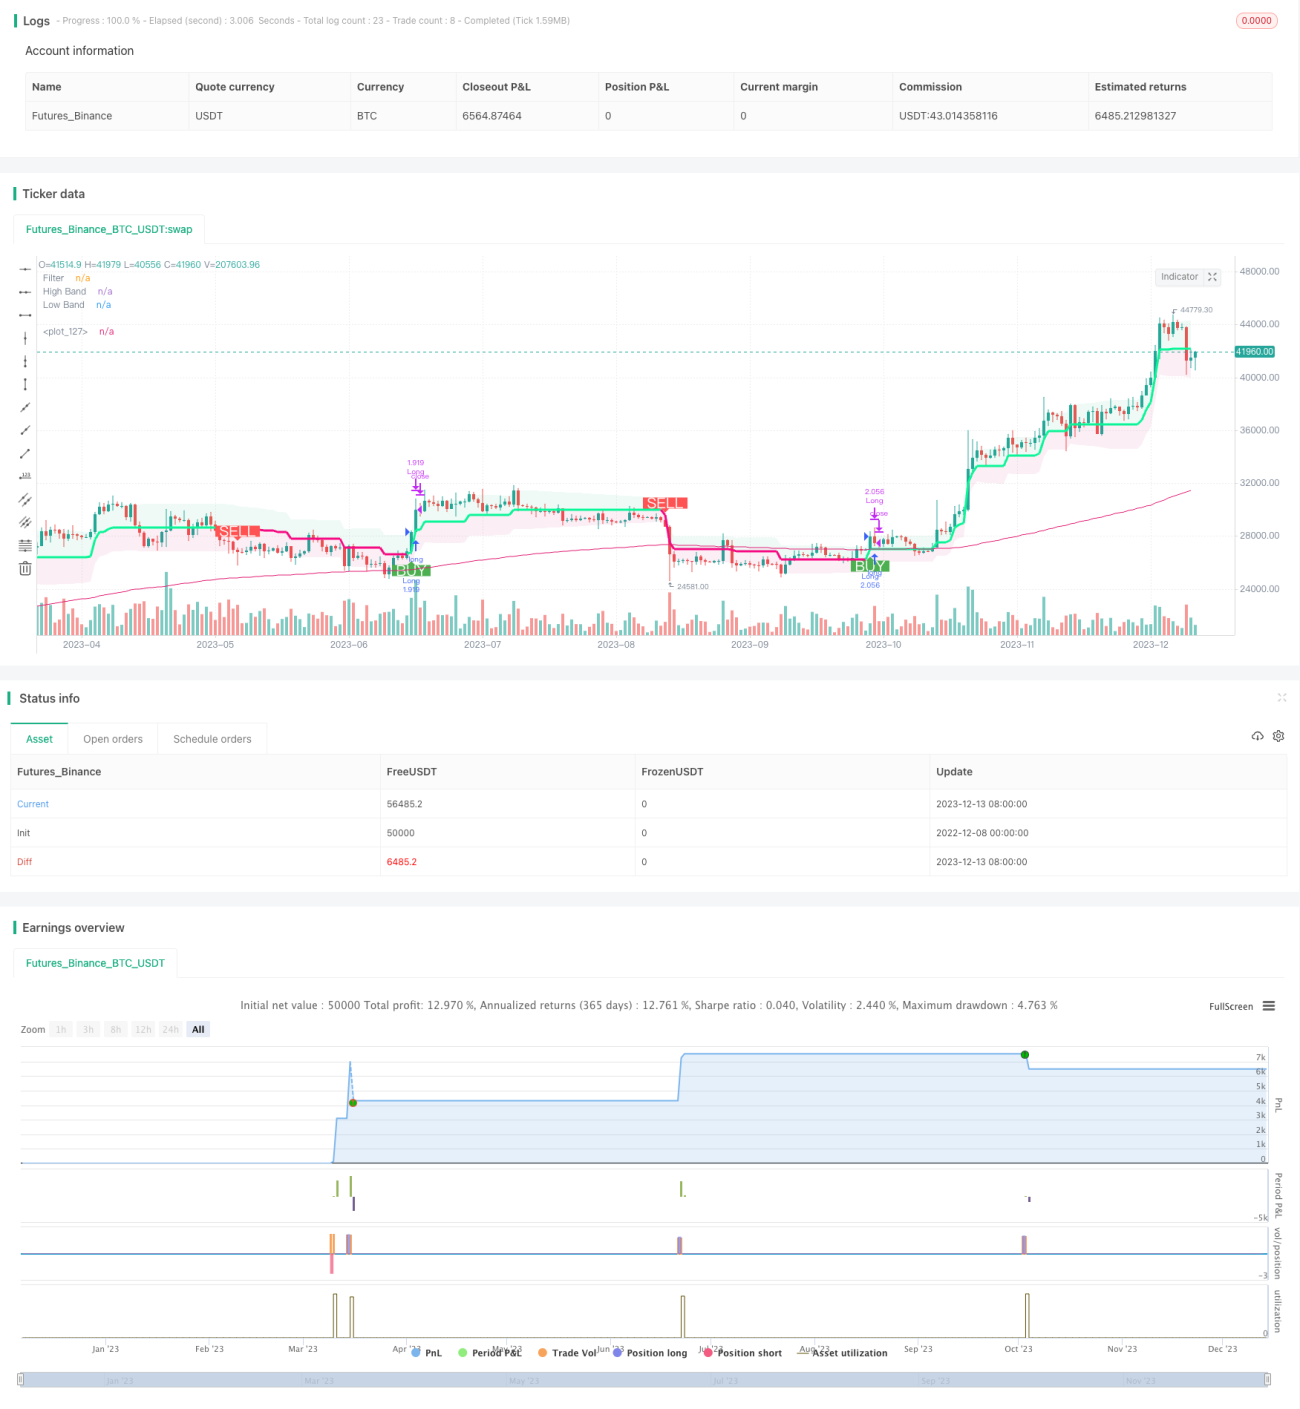
/*backtest
start: 2022-12-08 00:00:00
end: 2023-12-14 00:00:00
period: 1d
basePeriod: 1h
exchanges: [{"eid":"Futures_Binance","currency":"BTC_USDT"}]
*/

// This source code is subject to the terms of the Mozilla Public License 2.0 at https://mozilla.org/MPL/2.0/

// Credits to the original Script - Range Filter DonovanWall https://www.tradingview.com/script/lut7sBgG-Range-Filter-DW/
// This version is the old version of the Range Filter with less settings to tinker with- 1