Estrategia envolvente alcista de compra y venta
Descripción general
La estrategia de compra y venta de Bullish Engulfing es una estrategia de negociación cuantitativa basada en la forma de la línea K. La estrategia capta oportunidades de reversión en el precio de las acciones para obtener ganancias mediante la identificación de la forma de la línea K de Bullish Engulfing.
Las principales ventajas de esta estrategia son:
- Identificar oportunidades de reversión de precios de alta probabilidad basadas en una teoría de análisis técnico consolidada
- Las señales de intercambio son simples e intuitivas.
- El riesgo está bajo control
Principio de estrategia
La estrategia se basa en la forma de la línea K de engullido del bullish engulfing para determinar la reversión.
Cuando las acciones están en una tendencia bajista, si una entidad de la línea K menor aparece, la siguiente entidad de la línea K absorbe por completo a la anterior y el precio de cierre es superior al precio máximo de la línea K anterior, se forma un bullish engulfing, lo que indica que el precio está a punto de invertirse y el precio de las acciones aumentará.
Esta estrategia abre más posiciones cuando se identifica una forma de Bullish Engulfing y establece un Stop Loss Exit, con un objetivo de ganancias de 1%, pérdidas de 1%, y un bloqueo de ganancias.
Análisis de las ventajas estratégicas
La estrategia tiene las siguientes ventajas:
- Basado en la teoría de análisis técnico, Bullish Engulfing es una señal de reversión de precio de alta probabilidad que puede capturar de manera efectiva las oportunidades de reversión de precios.
- Las señales de transacción son sencillas, intuitivas, fáciles de entender y adecuadas para el comercio cuantitativo.
- La adopción de variedades de alta liquidez, como los futuros de índices de acciones, puede lograr una entrada y salida de alta eficiencia.
- La configuración de Stop Stop Loss Exit permite un buen control de la relación de pérdidas y ganancias de las operaciones individuales, garantiza resultados rentables y evita grandes pérdidas.
- Los parámetros de la estrategia se pueden ajustar con flexibilidad para adaptarse a diferentes variedades y entornos de mercado.
Análisis de riesgos estratégicos
La estrategia también tiene sus riesgos:
- Según la teoría del análisis técnico, existe un cierto riesgo de señales erróneas.
- Los cambios en las condiciones del mercado pueden hacer que los parámetros no sean válidos y requieran ajustes.
- Si la parada es demasiado pequeña, puede dar lugar a una pequeña parada, y si es demasiado grande, puede aumentar la pérdida.
En respuesta a estos riesgos, podemos tomar las siguientes medidas:
- Parámetros de optimización para comprobar su eficacia en diferentes mercados.
- Incrementar la amplitud de los paros para asegurar que los paros individuales estén controlados en un rango aceptable.
- Variedades de operaciones con una fluctuación moderada y buena liquidez, como índices o futuros de índices de acciones.
Dirección de optimización de la estrategia
La estrategia también puede ser optimizada en los siguientes aspectos:
- En combinación con los filtros de indicadores de tendencia, por ejemplo, la inclusión de un juicio de línea media para evitar el comercio en contra.
- Aumentar el margen de amortización y ampliar el margen de ganancias.
- Optimización de los mecanismos de detención de pérdidas, por ejemplo, elevando gradualmente los límites de detención a medida que los precios se mueven, reduciendo la probabilidad de detención de pérdidas.
- Utiliza una combinación de otras formas de la línea K similares a las de la barra Bullish Engulfing para formar una cartera de transacciones.
Resumir
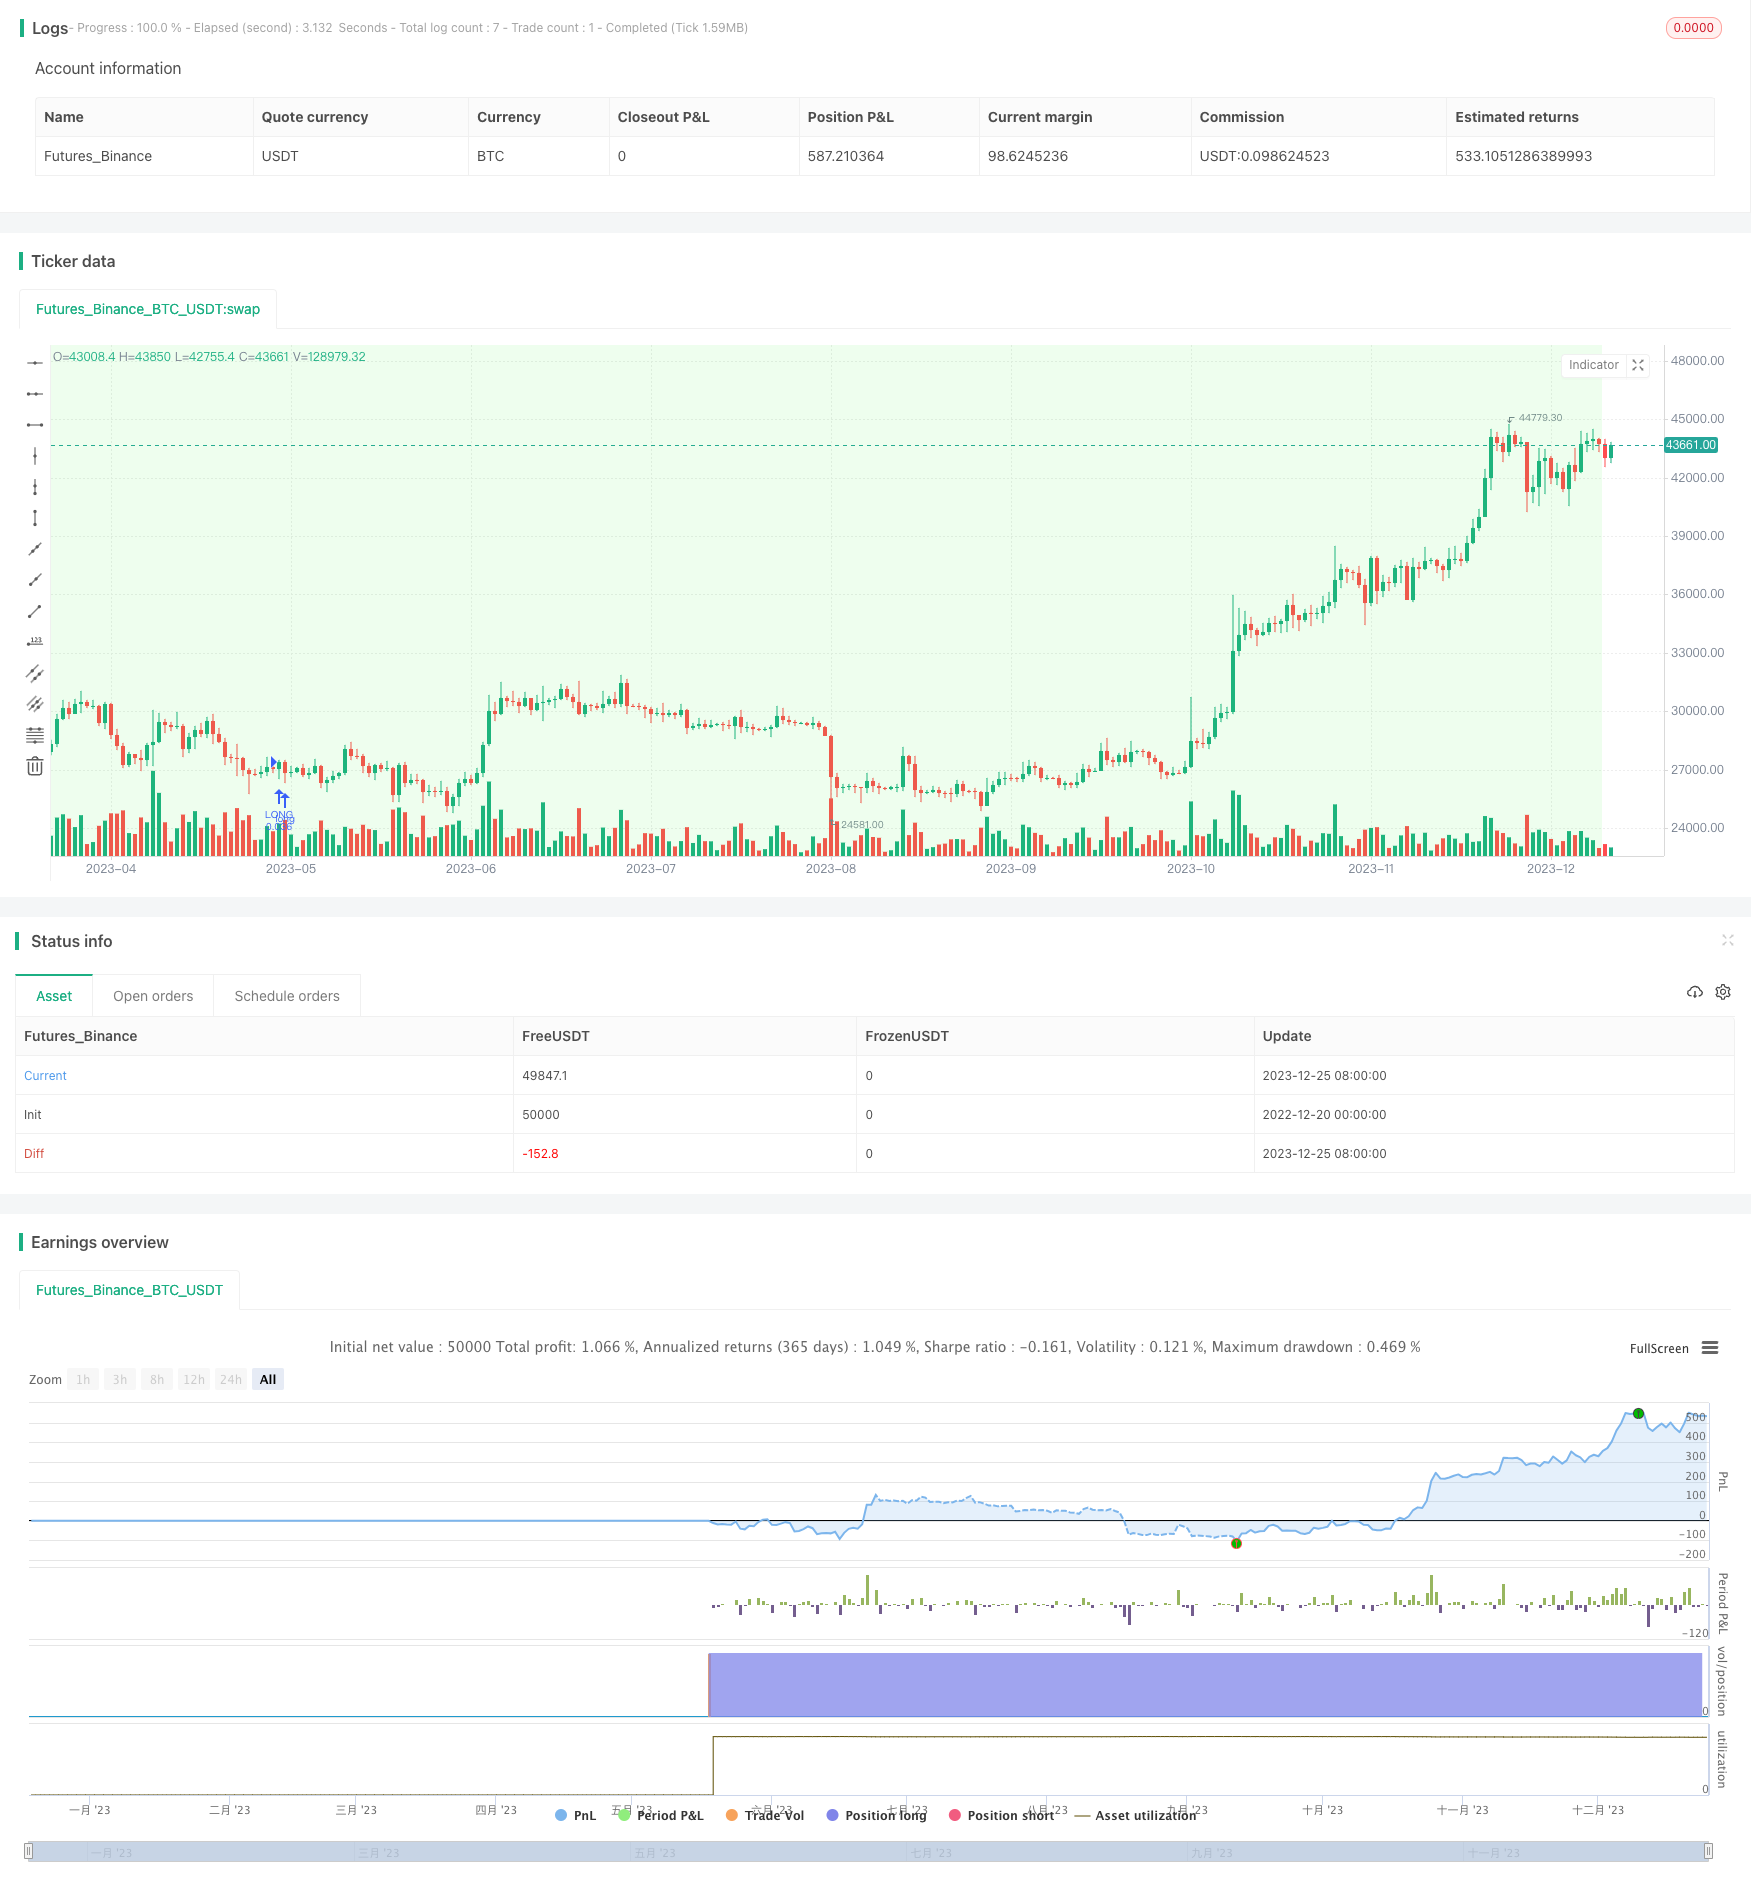
La estrategia de compra y venta de Bullish Engulfing es una estrategia de comercio cuantitativa basada en análisis técnico, con ventajas como la claridad y la simplicidad de las señales de comercio y la facilidad de implementación. En caso de optimización de parámetros y medidas de control de riesgo, se puede obtener una ganancia estable, lo cual es recomendable.
/*backtest
start: 2022-12-20 00:00:00
end: 2023-12-26 00:00:00
period: 1d
basePeriod: 1h
exchanges: [{"eid":"Futures_Binance","currency":"BTC_USDT"}]
*/

// This source code is subject to the terms of the Mozilla Public License 2.0 at https://mozilla.org/MPL/2.0/
// © thequantscience

// ██████╗ ██╗   ██╗██╗     ██╗     ██╗███████╗██╗  ██╗    ███████╗███╗   ██╗ ██████╗ ██╗   ██╗██╗     ███████╗██╗███╗   ██╗ ██████╗
// ██╔══██╗██║   ██║██║     ██║     ██║██╔════╝██║  ██║    ██╔════╝████╗  ██║██╔════╝ ██║   ██║██║     ██╔════╝██║████╗  ██║██╔════╝
// ██████╔╝██║   ██║██║     ██║     ██║███████╗███████║    █████╗  ██╔██╗ ██║██║  ███╗██║   ██║██║     █████╗  ██║██╔██╗ ██║██║  ███╗
// ██╔══██╗██║   ██║██║     ██║     ██║╚════██║██╔══██║    ██╔══╝  ██║╚██╗██║██║   ██║██║   ██║██║     ██╔══╝  ██║██║╚██╗██║██║   ██║
// ██████╔╝╚██████╔╝███████╗███████╗██║███████║██║  ██║    ███████╗██║ ╚████║╚██████╔╝╚██████╔╝███████╗██║     ██║██║ ╚████║╚██████╔╝
// ╚═════╝  ╚═════╝ ╚══════╝╚══════╝╚═╝╚══════╝╚═╝  ╚═╝    ╚══════╝╚═╝  ╚═══╝ ╚═════╝  ╚═════╝ ╚══════╝╚═╝     ╚═╝╚═╝  ╚═══╝ ╚═════╝

//@version=5
strategy(
     "Buy&Sell Bullish Engulfing - The Quant Science",
     overlay = true,
     default_qty_type = strategy.percent_of_equity,
     default_qty_value = 100,
     pyramiding = 1,
     currency = currency.EUR,
     initial_capital = 10000,
     commission_type = strategy.commission.percent,
     commission_value = 0.07,
     process_orders_on_close = true,
     close_entries_rule = "ANY"
     )

startDate  = input.int(title="D: ", defval=1,    minval=1,    maxval=31,   inline = 'Start', group = "START DATE BACKTESTING", tooltip = "D is Day, M is Month, Y is Year.")
startMonth = input.int(title="M: ", defval=1,    minval=1,    maxval=12,   inline = 'Start', group = "START DATE BACKTESTING", tooltip = "D is Day, M is Month, Y is Year.")
startYear  = input.int(title="Y: ", defval=2022, minval=1800, maxval=2100, inline = 'Start', group = "START DATE BACKTESTING", tooltip = "D is Day, M is Month, Y is Year.")

endDate    = input.int(title="D: ", defval=31,   minval=1,    maxval=31,   inline = 'End',   group = "END DATE BACKTESTING", tooltip = "D is Day, M is Month, Y is Year.")
endMonth   = input.int(title="M: ", defval=12,   minval=1,    maxval=12,   inline = 'End',   group = "END DATE BACKTESTING", tooltip = "D is Day, M is Month, Y is Year.")
endYear    = input.int(title="Y: ", defval=2023, minval=1800, maxval=2100, inline = 'End',   group = "END DATE BACKTESTING", tooltip = "D is Day, M is Month, Y is Year.")

inDateRange = (time >= timestamp(syminfo.timezone, startYear, startMonth, startDate, 0, 0)) and (time < timestamp(syminfo.timezone, endYear, endMonth, endDate, 0, 0))

PROFIT   = input.float(defval = 1, minval = 0, title = "Target profit (%): ", step = 0.10, group = "TAKE PROFIT-STOP LOSS")
STOPLOSS = input.float(defval = 1, minval = 0, title = "Stop Loss (%): ",     step = 0.10, group = "TAKE PROFIT-STOP LOSS")

var float equity_trades = 0
strategy.initial_capital = 50000
equity_trades := strategy.initial_capital
var float equity   = 0
var float qty_order   = 0
t_ordersize = "Percentage size of each new order. With 'Reinvestment Profit' activate, the size will be calculate on the equity, with 'Reinvestment Profit' deactivate the size will be calculate on the initial capital."
orders_size = input.float(defval = 2, title = "Orders size (%): ", minval = 0.10, step = 0.10,  maxval = 100, group = "RISK MANAGEMENT", tooltip = t_ordersize)
qty_order := ((equity_trades * orders_size) / 100 ) / close

C_DownTrend = true
C_UpTrend   = true
var trendRule1 = "SMA50"
var trendRule2 = "SMA50, SMA200"
var trendRule = input.string(trendRule1, "Detect Trend Based On", options=[trendRule1, trendRule2, "No detection"], group = "BULLISH ENGULFING")

if trendRule == trendRule1
	priceAvg = ta.sma(close, 50)
	C_DownTrend := close < priceAvg
	C_UpTrend := close > priceAvg

if trendRule == trendRule2
	sma200 = ta.sma(close, 200)
	sma50  = ta.sma(close, 50)
	C_DownTrend := close < sma50 and sma50 < sma200
	C_UpTrend := close > sma50 and sma50 > sma200
C_Len = 14
C_ShadowPercent = 5.0
C_ShadowEqualsPercent = 100.0
C_DojiBodyPercent = 5.0
C_Factor = 2.0

C_BodyHi = math.max(close, open)
C_BodyLo = math.min(close, open)
C_Body = C_BodyHi - C_BodyLo
C_BodyAvg = ta.ema(C_Body, C_Len)
C_SmallBody = C_Body < C_BodyAvg
C_LongBody = C_Body > C_BodyAvg
C_UpShadow = high - C_BodyHi
C_DnShadow = C_BodyLo - low
C_HasUpShadow = C_UpShadow > C_ShadowPercent / 100 * C_Body
C_HasDnShadow = C_DnShadow > C_ShadowPercent / 100 * C_Body
C_WhiteBody = open < close
C_BlackBody = open > close
C_Range = high-low
C_IsInsideBar = C_BodyHi[1] > C_BodyHi and C_BodyLo[1] < C_BodyLo
C_BodyMiddle = C_Body / 2 + C_BodyLo
C_ShadowEquals = C_UpShadow == C_DnShadow or (math.abs(C_UpShadow - C_DnShadow) / C_DnShadow * 100) < C_ShadowEqualsPercent and (math.abs(C_DnShadow - C_UpShadow) / C_UpShadow * 100) < C_ShadowEqualsPercent
C_IsDojiBody = C_Range > 0 and C_Body <= C_Range * C_DojiBodyPercent / 100
C_Doji = C_IsDojiBody and C_ShadowEquals

patternLabelPosLow  = low  - (ta.atr(30) * 0.6)
patternLabelPosHigh = high + (ta.atr(30) * 0.6)

label_color_bullish = input.color(color.rgb(43, 255, 0), title = "Label Color Bullish", group = "BULLISH ENGULFING")
C_EngulfingBullishNumberOfCandles = 2
C_EngulfingBullish = C_DownTrend and C_WhiteBody and C_LongBody and C_BlackBody[1] and C_SmallBody[1] and close >= open[1] and open <= close[1] and ( close > open[1] or open < close[1] )
if C_EngulfingBullish
    var ttBullishEngulfing = "Engulfing\nAt the end of a given downward trend, there will most likely be a reversal pattern. To distinguish the first day, this candlestick pattern uses a small body, followed by a day where the candle body fully overtakes the body from the day before, and closes in the trend’s opposite direction. Although similar to the outside reversal chart pattern, it is not essential for this pattern to completely overtake the range (high to low), rather only the open and the close."
    label.new(bar_index, patternLabelPosLow, text="BE", style=label.style_label_up, color = label_color_bullish, textcolor=color.white, tooltip = ttBullishEngulfing)
bgcolor(ta.highest(C_EngulfingBullish?1:0, C_EngulfingBullishNumberOfCandles)!=0 ? color.new(#21f321, 90) : na, offset=-(C_EngulfingBullishNumberOfCandles-1))

var float c       = 0
var float o       = 0
var float c_exit  = 0
var float c_stopl = 0

if C_EngulfingBullish and strategy.opentrades==0 and inDateRange
    c := strategy.equity
    o := close
    c_exit  := c + (c * PROFIT / 100)
    c_stopl := c - (c * STOPLOSS / 100)
    strategy.entry(id = "LONG", direction = strategy.long, qty = qty_order, limit = o)

if ta.crossover(strategy.equity, c_exit)
    strategy.exit(id = "CLOSE-LONG", from_entry = "LONG", limit = close)
if ta.crossunder(strategy.equity, c_stopl)
    strategy.exit(id = "CLOSE-LONG", from_entry = "LONG", limit = close)