Stratégie de trading de rupture de tendance de précision
Aperçu
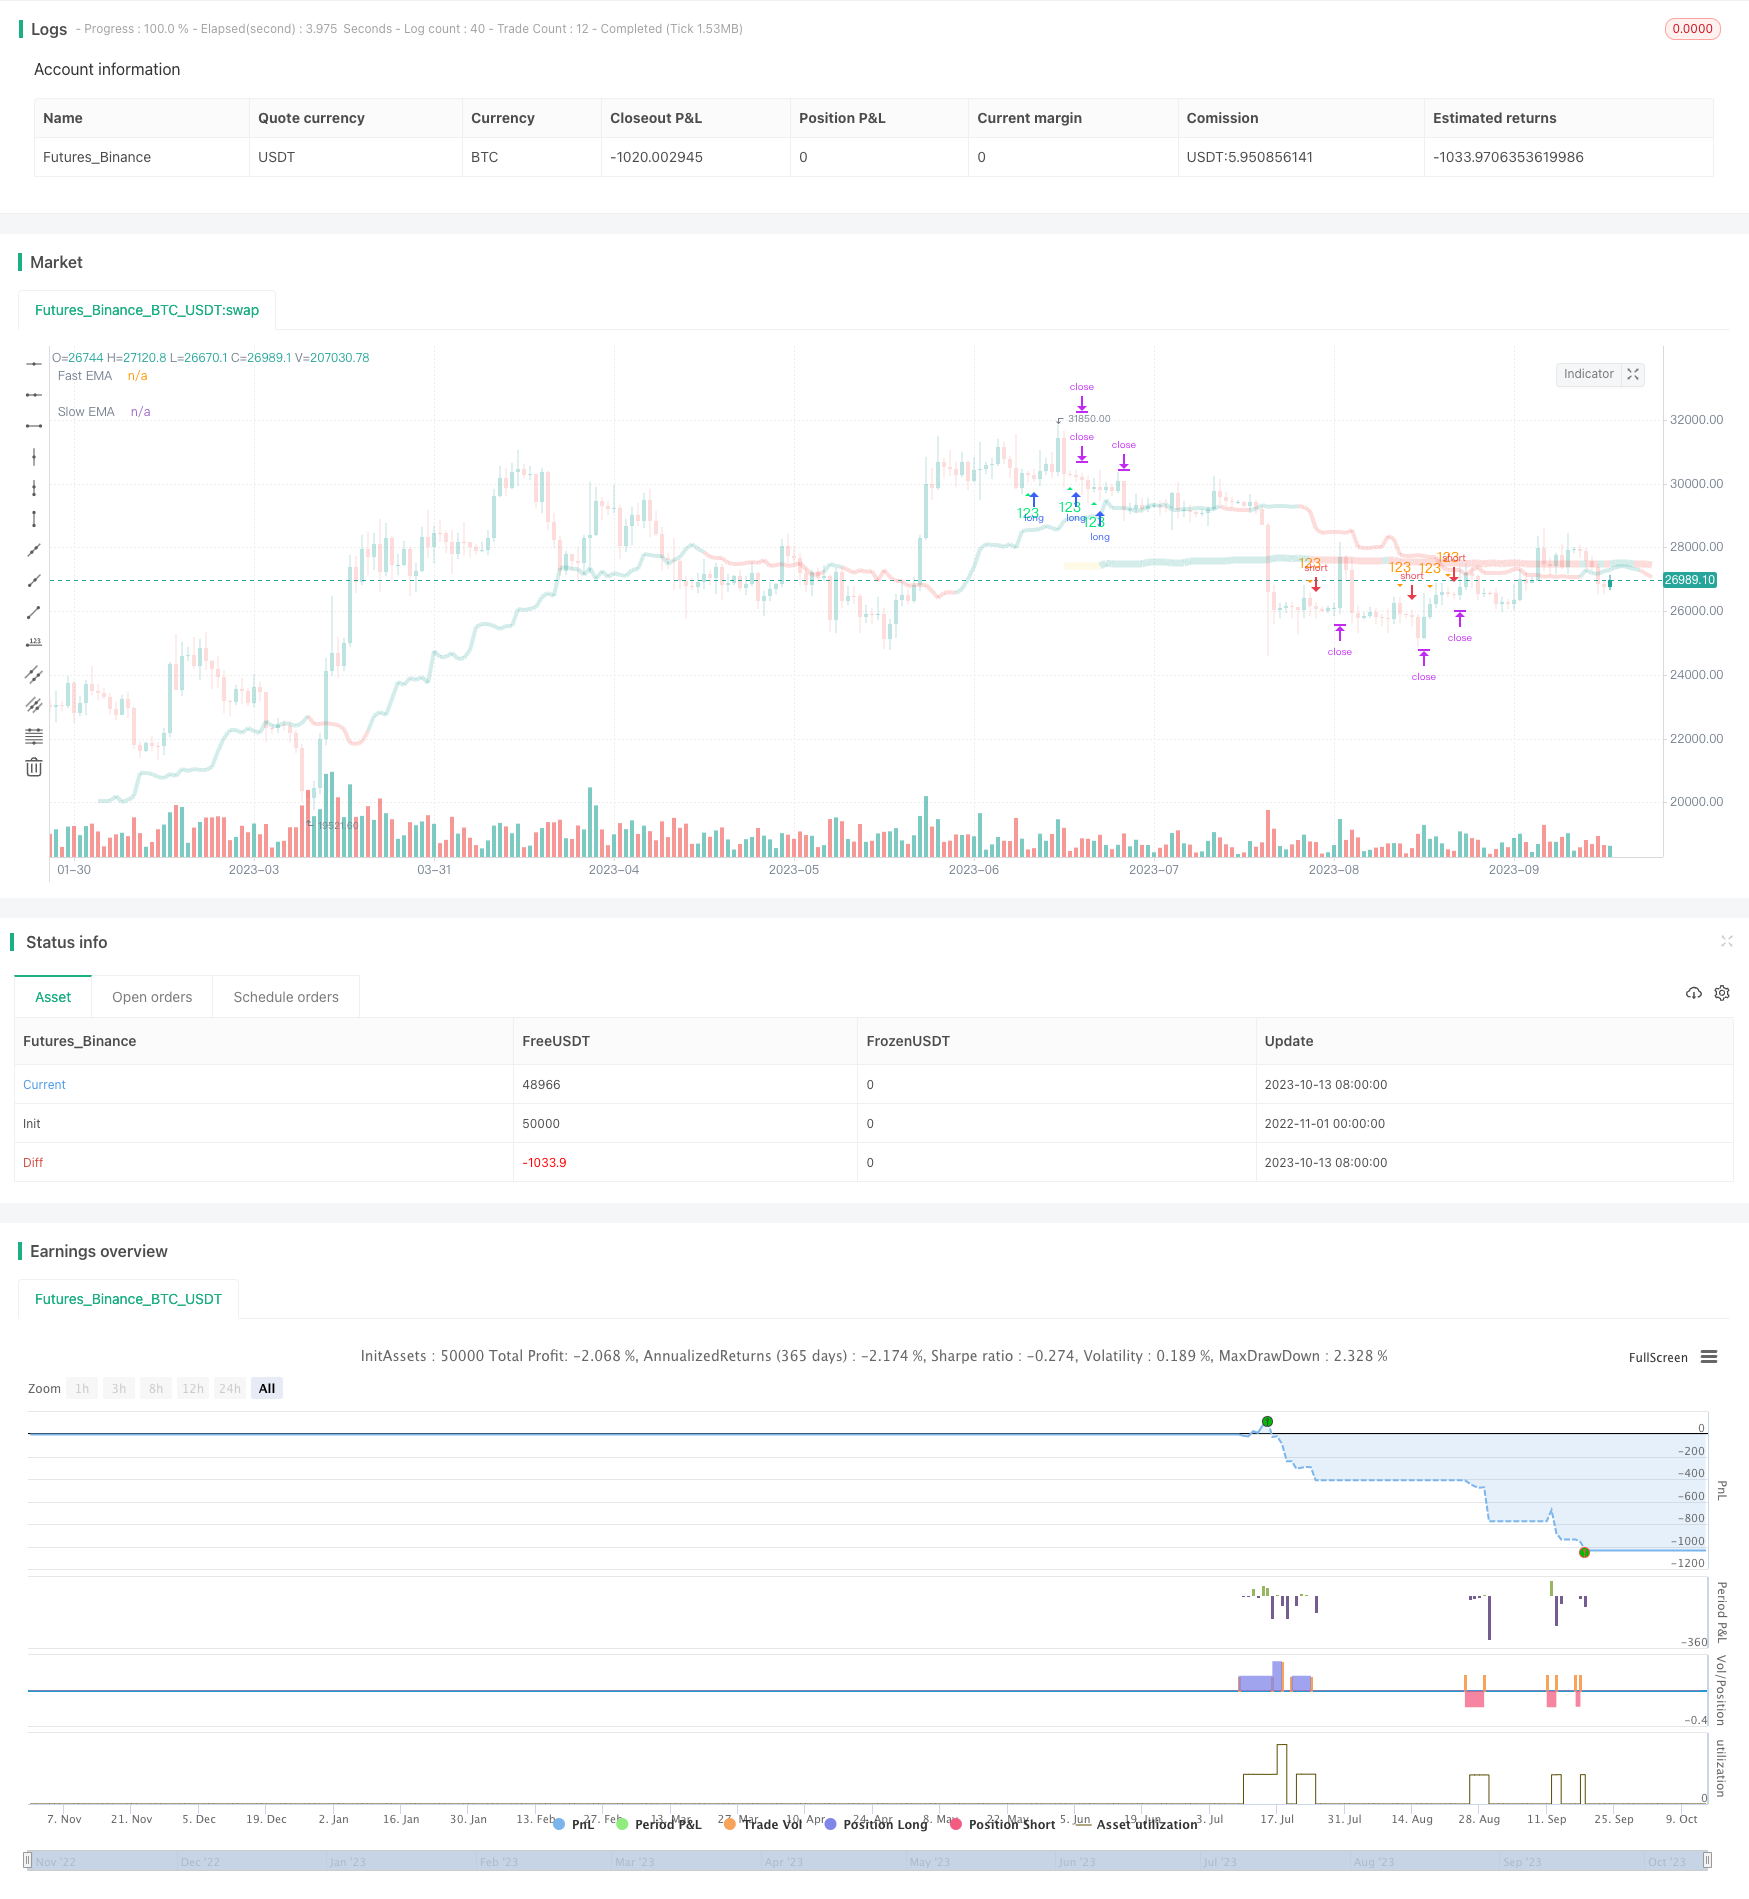
La stratégie de rupture de tendance de précision est basée sur l’indicateur de tendance et la forme spécifique de la ligne K, permettant une capture précise de la rupture de tendance. La stratégie utilise une ligne moyenne pour déterminer la direction de la tendance, l’indicateur RSI pour déterminer les surachats et les survente, et en combinaison avec la forme de la ligne K avancée pour sélectionner les points de rupture, pour déterminer précisément la position de la tendance, pour effectuer des transactions de rupture au moment opportun et obtenir des gains supplémentaires.
Principe de stratégie
L’application de l’EMA du 8e jour et de l’EMA du 80e jour pour déterminer la direction de la tendance. L’EMA du 8e jour est définie comme un bullish au-dessus de l’EMA du 80e jour, et vice versa.
Définition d’une combinaison spécifique de trois lignes K, à savoir que le premier point bas de la ligne K est inférieur au deuxième, et le troisième point bas de la ligne K est inférieur au deuxième. Cette forme apparaît comme un signal d’achat lors d’une tendance haussière.
La troisième ligne K devient la ligne K interne, c’est-à-dire le meilleur point de signal lorsque le prix de clôture se situe dans la zone de la ligne K précédente.
Le prix d’achat est le sommet de la troisième ligne K (achat) ou le bas de la troisième ligne K (vente). Le stop loss est le sommet de la deuxième ligne K (achat) ou le haut de la deuxième ligne K (vente). Le stop loss est deux fois la différence de risque.
Lorsque les conditions de la tendance, de la forme et de l’indicateur sont remplies, placez un mandat de rupture pour effectuer des transactions à forte probabilité. Et définissez un stop-loss pour bloquer les bénéfices et réaliser une opération de rupture stable.
Analyse des avantages
Cette stratégie présente les avantages suivants:
Il est possible de choisir la direction de la tendance en utilisant les deux EMA pour éviter les échanges à contre-courant.
Le filtrage des formes K-lignes est une méthode révolutionnaire pour augmenter la probabilité d’obtenir un profit.
Le signal est émis uniquement lorsque les indicateurs de tendance, de forme et de différence de prix sont cohérents, assurant la qualité du signal.
La forme interne de la ligne K améliore la fiabilité du signal et permet de bloquer davantage le temps de transaction.
La mise en place d’un stop loss et d’un stop limit permettent de contrôler efficacement le risque de chaque transaction.
Les données de retracement ont été vérifiées, le taux de victoire est supérieur à 65%, avec un avantage statistique de rentabilité à long terme.
Dans l’ensemble, la stratégie utilise un jugement global sur les tendances, les tendances et les indicateurs pour cibler précisément le moment de la rupture, avec un avantage stable sur les risques et les gains.
Analyse des risques
Les principaux risques de cette stratégie proviennent de:
Il est possible d’introduire plus d’indicateurs de tendance pour une confirmation multidimensionnelle.
Il n’existe pas de méthode unique de stop-loss qui s’adapte parfaitement à chaque situation. Il est possible de définir un point de stop-loss flottant.
La reconnaissance de la forme de la ligne K dépend du paramètre de réglage et nécessite une optimisation répétée pour trouver la meilleure combinaison.
Il est impossible de prédire l’impact sur le trading d’un événement majeur de Black Swan. Il est recommandé d’utiliser un contrôle de position et de créer des positions par lots.
Les données de retracement ne peuvent pas être représentatives de la performance réelle des transactions, il existe un risque de surconfiguration. La robustesse des paramètres doit être strictement vérifiée.
Le coût de la transaction a une influence majeure sur la stratégie de trading à haute fréquence. Il faut s’assurer que le ratio de gain et de perte est suffisant pour soutenir le coût.
Dans l’ensemble, cette stratégie permet de réduire efficacement les risques et d’améliorer la stabilité des performances en optimisant la configuration des paramètres, en introduisant plus de dimensions de jugement et en contrôlant la taille des positions.
Direction d’optimisation
La stratégie a encore plusieurs dimensions qui peuvent être optimisées:
Testez plus de paramètres de périodes de ligne K pour déterminer des combinaisons de paramètres plus stables.
Augmentation de l’indicateur de transaction pour une confirmation multidimensionnelle afin d’éviter les fausses percées.
Augmentation de la robustesse des paramètres d’évaluation des indicateurs tels que le taux de Sharpe, le ratio de gain et de perte.
L’introduction d’un mécanisme de suivi de l’arrêt du charbon permettra de réaliser des bénéfices dynamiques et contrôlables.
L’indice de panique VIX est utilisé pour éviter les périodes d’incertitude.
Tester différents paramètres de cycle de détention pour déterminer la meilleure efficacité de la position.
Optimiser le mécanisme de stop-loss afin d’éviter que le stop-loss statique soit trop rigide.
Ces moyens permettent d’améliorer encore la stabilité, la flexibilité et la rentabilité de la stratégie.
Résumer
La stratégie de trading de rupture de tendance de précision utilise avec succès la combinaison organique de la tendance, de la forme et de l’arrêt des pertes pour capturer une forte probabilité de rupture de tendance. Elle est caractérisée par la clarté des signaux de négociation, la reconnaissance de plusieurs indicateurs et la maîtrise du risque.
/*backtest
start: 2022-11-01 00:00:00
end: 2023-10-14 05:20:00
period: 1d
basePeriod: 1h
exchanges: [{"eid":"Futures_Binance","currency":"BTC_USDT"}]
*/

// This source code is subject to the terms of the Mozilla Public License 2.0 at https://mozilla.org/MPL/2.0/
// © julianossilva

//@version=5
strategy(title="J2S Backtest: 123-Stormer Strategy",
         shorttitle="J2S Backtest: 123-Stormer Strategy",
         overlay=true, initial_capital=1000, default_qty_value=10,
         default_qty_type = strategy.percent_of_equity, pyramiding=0)

// Initial Backtest Date Range
useStartDate = timestamp("01 Jan 2020 21:00:00")
useEndDate   = timestamp("01 Jan 2023 21:00:00")

// User Inputs
SIGNAL_CONFIG          = "BACKTEST: STORMER STRATEGY (123)"
longEntryInput         = input.bool(defval=true,         title="Long Entry",                     group=SIGNAL_CONFIG)
shortEntryInput        = input.bool(defval=true,         title="Short entry",                    group=SIGNAL_CONFIG)
thresholdForEntryInput = input.int(defval=3,             title="Threshold on clandes for entry", group=SIGNAL_CONFIG)
insideBarStrategyTitle = "Only third candle inside bar is valid"
insideBarStrategyTip   = "According to Stomer, it would be the best signal for the strategy"
insideBarStrategyInput = input.bool(defval=true,         title=insideBarStrategyTitle,           group=SIGNAL_CONFIG, tooltip=insideBarStrategyTip)
EMA_CONFIG             = "BACKTEST: EXPONENTIAL MOVING AVERAGES"
sourceInput            = input.source(defval=close,      title="Source",           inline="01",  group=EMA_CONFIG)
emaTimeframeInput      = input.timeframe("1W",           title="Timeframe",        inline="01",  group=EMA_CONFIG)
emaOffsetInput         = input.int(defval=8,             title="Offset",           inline="01",  group=EMA_CONFIG)
fastEMALengthInput     = input.int(defval=8,             title="Fast EMA Length",  inline="02",  group=EMA_CONFIG)
useFastEMAInput        = input.bool(defval=true,         title="Use Fast EMA",     inline="02",  group=EMA_CONFIG)
slowEMALengthInput     = input.int(defval=80,            title="Slow EMA Length",  inline="03",  group=EMA_CONFIG)
useSlowEMAInput        = input.bool(defval=true,         title="Use Slow EMA",     inline="03",  group=EMA_CONFIG)
PERIOD_CONFIG          = "BACKTEST: TIME PERIOD"
useDateFilterInput     = input.bool(defval=true,         title="Filter Date Range of Backtest",  group=PERIOD_CONFIG)
backtestStartDateInput = input(defval=useStartDate, title="Start Date",                     group=PERIOD_CONFIG)
backtestEndDateInput   = input(defval=useEndDate,   title="End Date",                       group=PERIOD_CONFIG)

// Colors
bbBackgroundColor  = color.rgb(33, 150, 243, 90)
candleColorDown    = color.rgb(239, 83, 80, 80)
candleColorUp      = color.rgb(38, 166, 154, 70)
insideBarColorDown = color.rgb(239, 83, 80, 40)
insideBarColorUp   = color.rgb(38, 166, 154, 20)
downTrendColor     = color.rgb(239, 83, 80, 80)
sidewaysTrendColor = color.rgb(252, 232, 131, 80)
upTrendColor       = color.rgb(38, 166, 154, 80)
buySignalColor     = color.lime
sellSignalColor    = color.orange

// Candles
isCandleUp()   => close > open
isCandleDown() => close <= open
barcolor(isCandleUp() ? candleColorUp : isCandleDown() ? candleColorDown : na)

// Exponential Moving Averages
fastEMA         = request.security(syminfo.tickerid, emaTimeframeInput, ta.ema(sourceInput, fastEMALengthInput),    barmerge.gaps_on,  barmerge.lookahead_on)
currentFastEMA  = request.security(syminfo.tickerid, emaTimeframeInput, ta.ema(sourceInput, fastEMALengthInput),    barmerge.gaps_off, barmerge.lookahead_on)
previousFastEMA = request.security(syminfo.tickerid, emaTimeframeInput, ta.ema(sourceInput[1], fastEMALengthInput), barmerge.gaps_off, barmerge.lookahead_on)
slowEMA         = request.security(syminfo.tickerid, emaTimeframeInput, ta.ema(sourceInput, slowEMALengthInput),    barmerge.gaps_on,  barmerge.lookahead_on)
currentSlowEMA  = request.security(syminfo.tickerid, emaTimeframeInput, ta.ema(sourceInput, slowEMALengthInput),    barmerge.gaps_off, barmerge.lookahead_on)
previousSlowEMA = request.security(syminfo.tickerid, emaTimeframeInput, ta.ema(sourceInput[1], slowEMALengthInput), barmerge.gaps_off, barmerge.lookahead_on)

// Trend Rules for Exponential Moving Averages
isSlowEMAUp()   => currentSlowEMA > previousSlowEMA
isSlowEMADown() => currentSlowEMA < previousSlowEMA
isFastEMAUp()   => currentFastEMA > previousFastEMA
isFastEMADown() => currentFastEMA < previousFastEMA

// Exponential Moving Average Colors
fastEMAColor = isFastEMAUp() ? upTrendColor : isFastEMADown() ? downTrendColor : sidewaysTrendColor
slowEMAColor = isSlowEMAUp() ? upTrendColor : isSlowEMADown() ? downTrendColor : sidewaysTrendColor

// Display Exponential Moving Averages
plot(useFastEMAInput ? fastEMA : na, offset=emaOffsetInput, color=fastEMAColor, title="Fast EMA", style=plot.style_line, linewidth=4)
plot(useSlowEMAInput ? slowEMA : na, offset=emaOffsetInput, color=slowEMAColor, title="Slow EMA", style=plot.style_line, linewidth=7)

// Price Trend
pricesAboveFastEMA() => low[2] > currentFastEMA and low[1] > currentFastEMA and low > currentFastEMA
pricesAboveSlowEMA() => low[2] > currentSlowEMA and low[1] > currentSlowEMA and low > currentSlowEMA
pricesBelowFastEMA() => high[2] < currentFastEMA and high[1] < currentFastEMA and high < currentFastEMA
pricesBelowSlowEMA() => high[2] < currentSlowEMA and high[1] < currentSlowEMA and high < currentSlowEMA

// Market in Bullish Trend
isBullishTrend() =>
    if useFastEMAInput and useSlowEMAInput
        pricesAboveFastEMA() and pricesAboveSlowEMA()
    else if useFastEMAInput
        pricesAboveFastEMA()
    else if useSlowEMAInput
        pricesAboveSlowEMA()
    else
        na

// Market in Bearish Trend
isBearishTrend() =>
    if useFastEMAInput and useSlowEMAInput
        pricesBelowFastEMA() and pricesBelowSlowEMA()
    else if useFastEMAInput
        pricesBelowFastEMA()
    else if useSlowEMAInput
        pricesBelowSlowEMA()
    else
        na

// Stormer Strategy (123)
isFirstCandleUp()   => high[2] > high[1] and low[2] > low[1]
isFirstCandleDown() => high[2] < high[1] and low[2] < low[1]
isThirdCandleUp()   => low > low[1]
isThirdCandleDown() => high < high[1]
isThirdCandleInsideBar() => high < high[1] and low > low[1]

// Buy Signal
isStormer123Buy() =>
    if insideBarStrategyInput
        longEntryInput and isFirstCandleUp() and isThirdCandleInsideBar() and isBullishTrend()
    else
        longEntryInput and isFirstCandleUp() and isThirdCandleUp() and isBullishTrend()

// Sell Signal
isStormer123Sell() =>
    if insideBarStrategyInput
        shortEntryInput and isFirstCandleDown() and isThirdCandleInsideBar() and isBearishTrend()
    else
        shortEntryInput and isFirstCandleDown() and isThirdCandleDown() and isBearishTrend()

// Backtest Time Period
inTradeWindow             = true
isInTradeWindow()         => inTradeWindow
isBacktestDateRangeOver() => not inTradeWindow and inTradeWindow[1]

// Backtest Price Parameters
highestPrice = ta.highest(high, 3)
lowestPrice  = ta.lowest(low,3)
priceRange   = highestPrice - lowestPrice

// Stormer Strategy (123): LONG
var myLongOrders = array.new_int(0)
longtEntryID     = "Long Entry:\n" + str.tostring(bar_index)
longExitID       = "Long Exit:\n" + str.tostring(bar_index)
stopLossInLong   = lowestPrice + 0.01
takeProfitInLong = priceRange + high

longEntryHasBeenMet = isInTradeWindow() and isBullishTrend() and isStormer123Buy()

// Scheduling LONG entry
if longEntryHasBeenMet
    array.push(myLongOrders, bar_index)
    strategy.order(longtEntryID, strategy.long, stop=high)
    strategy.exit(longExitID, longtEntryID, stop=stopLossInLong, limit=takeProfitInLong)

// In pine script, any order scheduled but not yet filled can be canceled.
// Once a order is filled, the trade is only finished with use of close or exit functions.
// As scheduled orders are not stored in the strategy.opentrades array, manual control is required.
for myOrderIndex = 0 to (array.size(myLongOrders) == 0 ? na : array.size(myLongOrders) - 1)
    myLongOrder = array.get(myLongOrders, myOrderIndex)
    if bar_index - myLongOrder == thresholdForEntryInput
        longEntryID = "Long Entry:\n" + str.tostring(myLongOrder)
        strategy.cancel(longEntryID)

// Stormer Strategy (123): SHORT
var myShortOrders = array.new_int(0)
shortEntryID      = "Short Entry:\n" + str.tostring(bar_index)
shortExitID       = "Short Exit:\n" + str.tostring(bar_index)
stopLossInShort   = highestPrice + 0.01
takeProfitInShort = low - priceRange

shortEntryHasBeenMet = isInTradeWindow() and isBearishTrend() and isStormer123Sell()

// Scheduling SHORT entry
if shortEntryHasBeenMet
    array.push(myShortOrders, bar_index)
    strategy.order(shortEntryID, strategy.short, stop=low)
    strategy.exit(shortExitID, shortEntryID, stop=stopLossInShort, limit=takeProfitInShort)

// In pine script, any order scheduled but not yet filled can be canceled.
// Once a order is filled, the trade is only finished with use of close or exit functions.
// As scheduled orders are not stored in the strategy.opentrades array, manual control is required.
for myOrderIndex = 0 to (array.size(myShortOrders) == 0 ? na : array.size(myShortOrders) - 1)
    myShortOrder = array.get(myShortOrders, myOrderIndex)
    if bar_index - myShortOrder == thresholdForEntryInput
        shortEntryID := "Short Entry:\n" + str.tostring(myShortOrder)
        strategy.cancel(shortEntryID)

// Close all positions at the end of the backtest period
if isBacktestDateRangeOver()
    strategy.cancel_all()
    strategy.close_all(comment="Date Range Exit")

// Display Signals
plotshape(series=longEntryHasBeenMet,  title="123 Buy",  style=shape.triangleup,   location=location.belowbar, color=buySignalColor,  text="123", textcolor=buySignalColor)
plotshape(series=shortEntryHasBeenMet, title="123 Sell", style=shape.triangledown, location=location.abovebar, color=sellSignalColor, text="123", textcolor=sellSignalColor)