
Cette stratégie combine les quatre indicateurs RSI, MFI, Stoch RSI et MACD pour permettre la négociation intraday de Bitcoin. La stratégie prend des ordres pour contrôler le risque lorsque plusieurs indicateurs émettent simultanément des signaux d’achat ou de vente.
L’indicateur RSI est utilisé pour déterminer si le marché est en sur-achat ou en sur-vente. Un RSI inférieur à 40 génère un signal d’achat et un RSI supérieur à 70 génère un signal de vente.
L’indicateur MFI détermine le flux de fonds sur le marché. Les MFI produisent un signal d’achat lorsque leur valeur est inférieure à 23 et un signal de vente lorsqu’elle est supérieure à 80.
Le Stoch RSI détermine si le marché est en sur-achat ou en sur-vente. Un signal de vente se produit lorsque la ligne K est inférieure à 34, et un signal de vente lorsque la ligne est supérieure à 80.
L’indicateur MACD détermine la tendance et la dynamique du marché. La ligne rapide est inférieure à la ligne lente et produit un signal d’achat lorsque la colonne est négative, au contraire, elle produit un signal de vente.
La combinaison des quatre indicateurs permet d’améliorer l’exactitude du signal et d’éviter les pertes causées par la défaillance d’un seul indicateur.
La probabilité d’un faux signal est considérablement réduite si plusieurs indicateurs émettent des signaux simultanément.
Utilisez des stratégies de trading en journée pour éviter les risques du jour au lendemain et réduire le coût des fonds.
La fréquence de négociation de la stratégie peut être faible et il existe un certain risque temporel. Les paramètres de l’indicateur peuvent être assouplis de manière appropriée pour augmenter le nombre de transactions.
La probabilité que l’indicateur émette un mauvais signal existe toujours. Des algorithmes d’apprentissage automatique peuvent être introduits pour aider à juger de la fiabilité du signal de l’indicateur.
Il existe un certain risque d’achat et de vente excessif. Les paramètres de l’indicateur peuvent être ajustés de manière appropriée ou d’autres logiques de jugement peuvent être ajoutées.
Ajout d’une fonctionnalité d’adaptation des paramètres de l’indicateur. Paramètres de l’indicateur sont ajustés en temps réel en fonction de la volatilité du marché et de la vitesse de changement.
Ajout d’une logique d’arrêt des pertes. Si les pertes dépassent un certain pourcentage, les pertes s’arrêtent et les pertes sont effectivement contrôlées.
L’augmentation de la chaleur du marché, le degré de panique du marché et d’autres jugements multidimensionnels, améliorent l’espace de profit stratégique.
Cette stratégie, qui émet des signaux par l’intermédiaire de quatre indicateurs mutuellement vérifiés, réduit efficacement le taux de faux signaux et constitue une stratégie de gain de fréquence élevée relativement stable. Avec l’optimisation continue des paramètres et des modèles, le taux de victoire et la rentabilité de la stratégie devraient être encore améliorés.
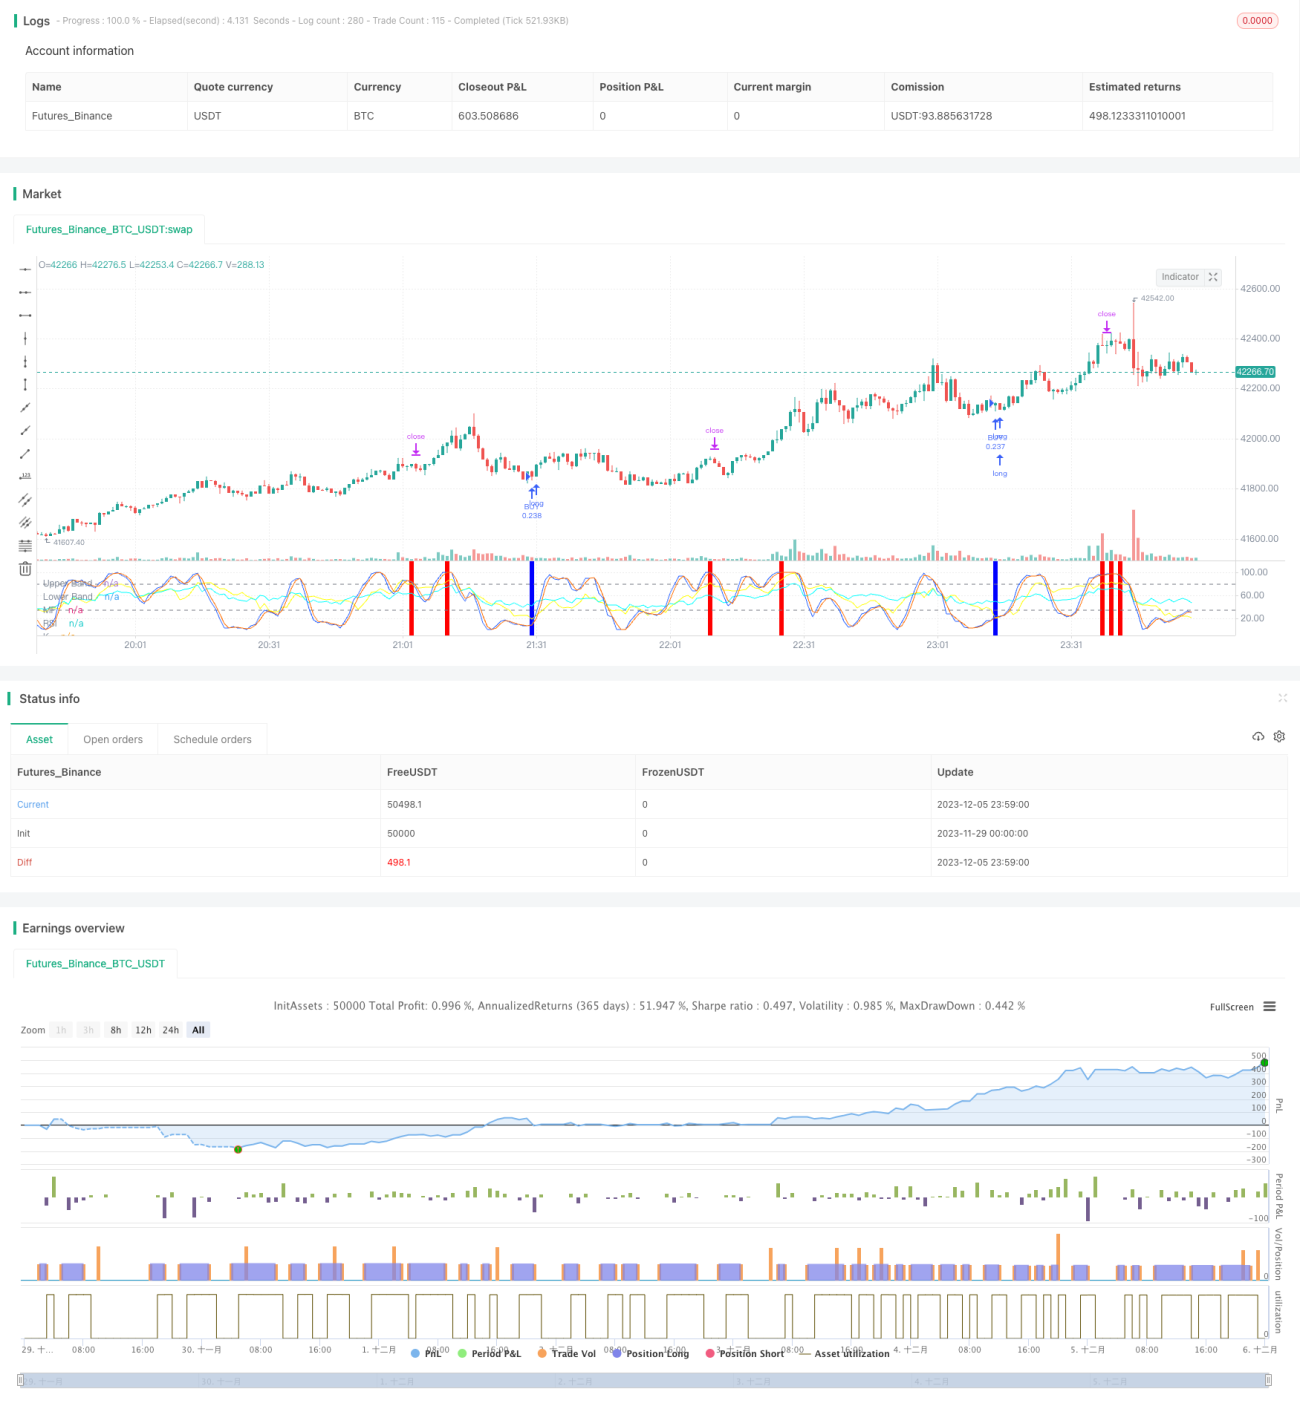
/*backtest
start: 2023-11-29 00:00:00
end: 2023-12-06 00:00:00
period: 1m
basePeriod: 1m
exchanges: [{"eid":"Futures_Binance","currency":"BTC_USDT"}]
*/
//@version=5
strategy('John Day Stop Loss', overlay=false, pyramiding=1, default_qty_type=strategy.cash, default_qty_value=10000, initial_capital=10000, currency='USD', precision=2)
strategy.risk.allow_entry_in(strategy.direction.long)
from_day = input.int(defval=1, title='From Day', minval=1)
from_month = input.int(defval=1, title='From Month', minval=1)
from_year = input.int(defval=2021, title='From Year', minval=2020)
to_day = input.int(defval=1, title='To Day', minval=1)
to_month = input.int(defval=1, title='To Month', minval=1)
to_year = input.int(defval=2025, title='To Year', minval=2020)
time_cond = time > timestamp(from_year, from_month, from_day, 00, 00) and time < timestamp(to_year, to_month, to_day, 00, 00)
//time_cond = true
//Stop Loss
longProfitPerc = input.float(title="Stop Loss Profit (%)", defval=2.1) / 100
longExitPrice = strategy.position_avg_price * (1 - longProfitPerc)
//RSI - yellow
up = ta.rma(math.max(ta.change(close), 0), 14)
down = ta.rma(-math.min(ta.change(close), 0), 14)
rsi = down == 0 ? 100 : up == 0 ? 0 : 100 - (100 / (1 + up / down))
plot(rsi, "RSI", color=#00FFFF)
buy_rsi = true // rsi < 40
sell_rsi = true //rsi > 70
//MFI - cyan
mf = ta.mfi(hlc3, 14)
plot(mf, "MF", color=#FFFF00)
buy_mfi = mf < input.int(defval=23, title='Max MF', minval=1)
sell_mfi = mf > input.int(defval=80, title='Min MF', minval=1)
//Stoch RSI
OverBought_StochRSI = input(80)
OverSold_StochRSI = input(34)
smoothK = input.int(3, "K", minval=1)
smoothD = input.int(2, "D", minval=1)
lengthRSI = input.int(14, "RSI Length", minval=1)
lengthStoch = input.int(14, "Stochastic Length", minval=1)
srcRSI = input(close, title="RSI Source")
rsi1 = ta.rsi(srcRSI, lengthRSI)
kStochRSI = ta.sma(ta.stoch(rsi1, rsi1, rsi1, lengthStoch), smoothK)
d = ta.sma(kStochRSI, smoothD)
co = ta.crossover(kStochRSI,d)
cu = ta.crossunder(kStochRSI,d)
buy_stochRSI = co and kStochRSI < OverSold_StochRSI
sell_stochRSI = cu and kStochRSI > OverBought_StochRSI
plot(kStochRSI, "K", color=#2962FF)
plot(d, "D", color=#FF6D00)
h0 = hline(OverBought_StochRSI, "Upper Band", color=#787B86)
h1 = hline(OverSold_StochRSI, "Lower Band", color=#787B86)
fill(h0, h1, color=color.rgb(33, 150, 243, 90), title="Background")
//MACD
// Getting inputs
fast_length = input(title="Fast Length", defval=12)
slow_length = input(title="Slow Length", defval=26)
src = input(title="Source", defval=close)
signal_length = input.int(title="Signal Smoothing", minval = 1, maxval = 50, defval = 9)
sma_source = input.string(title="Oscillator MA Type", defval="EMA", options=["SMA", "EMA"])
sma_signal = input.string(title="Signal Line MA Type", defval="EMA", options=["SMA", "EMA"])
// Plot colors
//col_macd = input(#2962FF, "MACD Line ", group="Color Settings", inline="MACD")
//col_signal = input(#FF6D00, "Signal Line ", group="Color Settings", inline="Signal")
//col_grow_above = input(#26A69A, "Above Grow", group="Histogram", inline="Above")
//col_fall_above = input(#B2DFDB, "Fall", group="Histogram", inline="Above")
//col_grow_below = input(#FFCDD2, "Below Grow", group="Histogram", inline="Below")
//col_fall_below = input(#FF5252, "Fall", group="Histogram", inline="Below")
// Calculating
fast_ma = sma_source == "SMA" ? ta.sma(src, fast_length) : ta.ema(src, fast_length)
slow_ma = sma_source == "SMA" ? ta.sma(src, slow_length) : ta.ema(src, slow_length)
macd = fast_ma - slow_ma
signal = sma_signal == "SMA" ? ta.sma(macd, signal_length) : ta.ema(macd, signal_length)
hist = macd - signal
buy_MACD = macd < signal and hist < 0
sell_MACD = macd > signal and hist > 0
//buy_MACD = true
//sell_MACD = true
//plot(hist, title="Histogram", style=plot.style_columns, color=(hist>=0 ? (hist[1] < hist ? col_grow_above : col_fall_above) : (hist[1] < hist ? col_grow_below : col_fall_below)))
//plot(macd, title="MACD", color=col_macd)
//plot(signal, title="Signal", color=col_signal)
sessionColor = color(na)
if time_cond
if (not na(kStochRSI) and not na(d))
cmt = str.tostring(close)
if (buy_stochRSI and buy_MACD and buy_mfi and buy_rsi)
strategy.entry("BUY", strategy.long, comment='BUY @ ' + cmt)
if longProfitPerc != 0
strategy.exit(id="x", stop=longExitPrice, comment='EXIT @ ' + str.tostring(longExitPrice))
sessionColor := input.color(#0000FF, "buy") //red
if (sell_stochRSI and sell_MACD and sell_mfi and sell_rsi)
strategy.entry("SELL", strategy.short, comment='SELL @ ' + cmt)
sessionColor := input.color(#FF0000, "sell") //green
bgcolor(sessionColor)