Stratégie double Bollinger+RSI (long uniquement) v1.2

Nom de la stratégie
Bollinger + RSI double ou multiple
Deuxième vue d'ensemble de la stratégie
Cette stratégie utilise une combinaison de l'indicateur de la ligne de browning et de l'indicateur RSI pour faire une position plus élevée lorsque les deux affichent simultanément un signal de survente et une position plus basse lorsque les deux affichent simultanément un signal de survente. Comparé à un seul indicateur, il est plus fiable de confirmer le signal de transaction et d'éviter les faux signaux.
Troisièmement, le principe de stratégie
- L'indicateur RSI est utilisé pour juger de l'excédent d'achat et de la survente
- RSI inférieur à 50 est considéré comme une survente
- RSI supérieur à 50 est considéré comme un sur-achat
- Ligne de Brin pour détecter des anomalies de prix
- Les prix en dessous de la voie ferrée sont considérés comme des soldes.
- Les prix supérieurs à ceux de la voie ferrée sont considérés comme des surachats
- Lorsque le RSI et la ligne de Brin affichent simultanément un signal de survente, placez-vous plus
- Le RSI est inférieur à 50.
- La ligne de prix est en dessous de la ligne de train de Brin
- Lorsque le RSI et la ligne de Brent affichent simultanément des signaux de survente, la position est levée.
- Le RSI est supérieur à 50.
- La ligne de prix est plus élevée que celle de Brin.
Quatrièmement, les avantages stratégiques
- La combinaison des deux indicateurs permet d'obtenir un signal plus fiable et d'éviter les fausses signaux.
- Créer des positions multiples, simplifier la logique et réduire le risque de transaction
Cinquièmement, les risques stratégiques et les solutions
- Les paramètres de la ligne de browning sont mal configurés, les restrictions d'ascension et de descente sont trop larges, ce qui augmente le risque d'erreur de transaction
- Optimiser les paramètres de la ligne de boulonnage, régler raisonnablement la période de la ligne de boulonnage et le décalage standard
- Les paramètres RSI sont mal réglés, les critères de jugement de surachat et de survente sont incorrects, ce qui augmente le risque de transaction erronée
- Optimiser les paramètres du RSI, ajuster les cycles du RSI et définir de manière rationnelle les critères de surachat et de survente
- Ravin n'est pas efficace quand il n'y a pas de tendance
- Les indicateurs tendanciels sont combinés pour éviter les chocs.
Sixièmement, améliorer la stratégie
- Optimiser les paramètres de la ligne de boulon et du RSI
- Augmentation du mécanisme de prévention des pertes
- Indicateur de tendance associé au MACD
- Augmenter les jugements combinant courte et longue ligne
VII. Conclusion
Cette stratégie combine les avantages des deux indicateurs Brinline et RSI, qui affichent simultanément des signaux de surachat et de survente, évitant ainsi les faux signaux générés par un seul indicateur, ce qui améliore la précision du signal. Par rapport à la version précédente, la création de positions multiples réduit le risque de transaction. La stratégie peut ensuite être optimisée par l'optimisation des paramètres, le mécanisme de stop-loss et la combinaison avec des indicateurs de tendance, etc., afin de mieux s'adapter aux différentes conditions du marché.
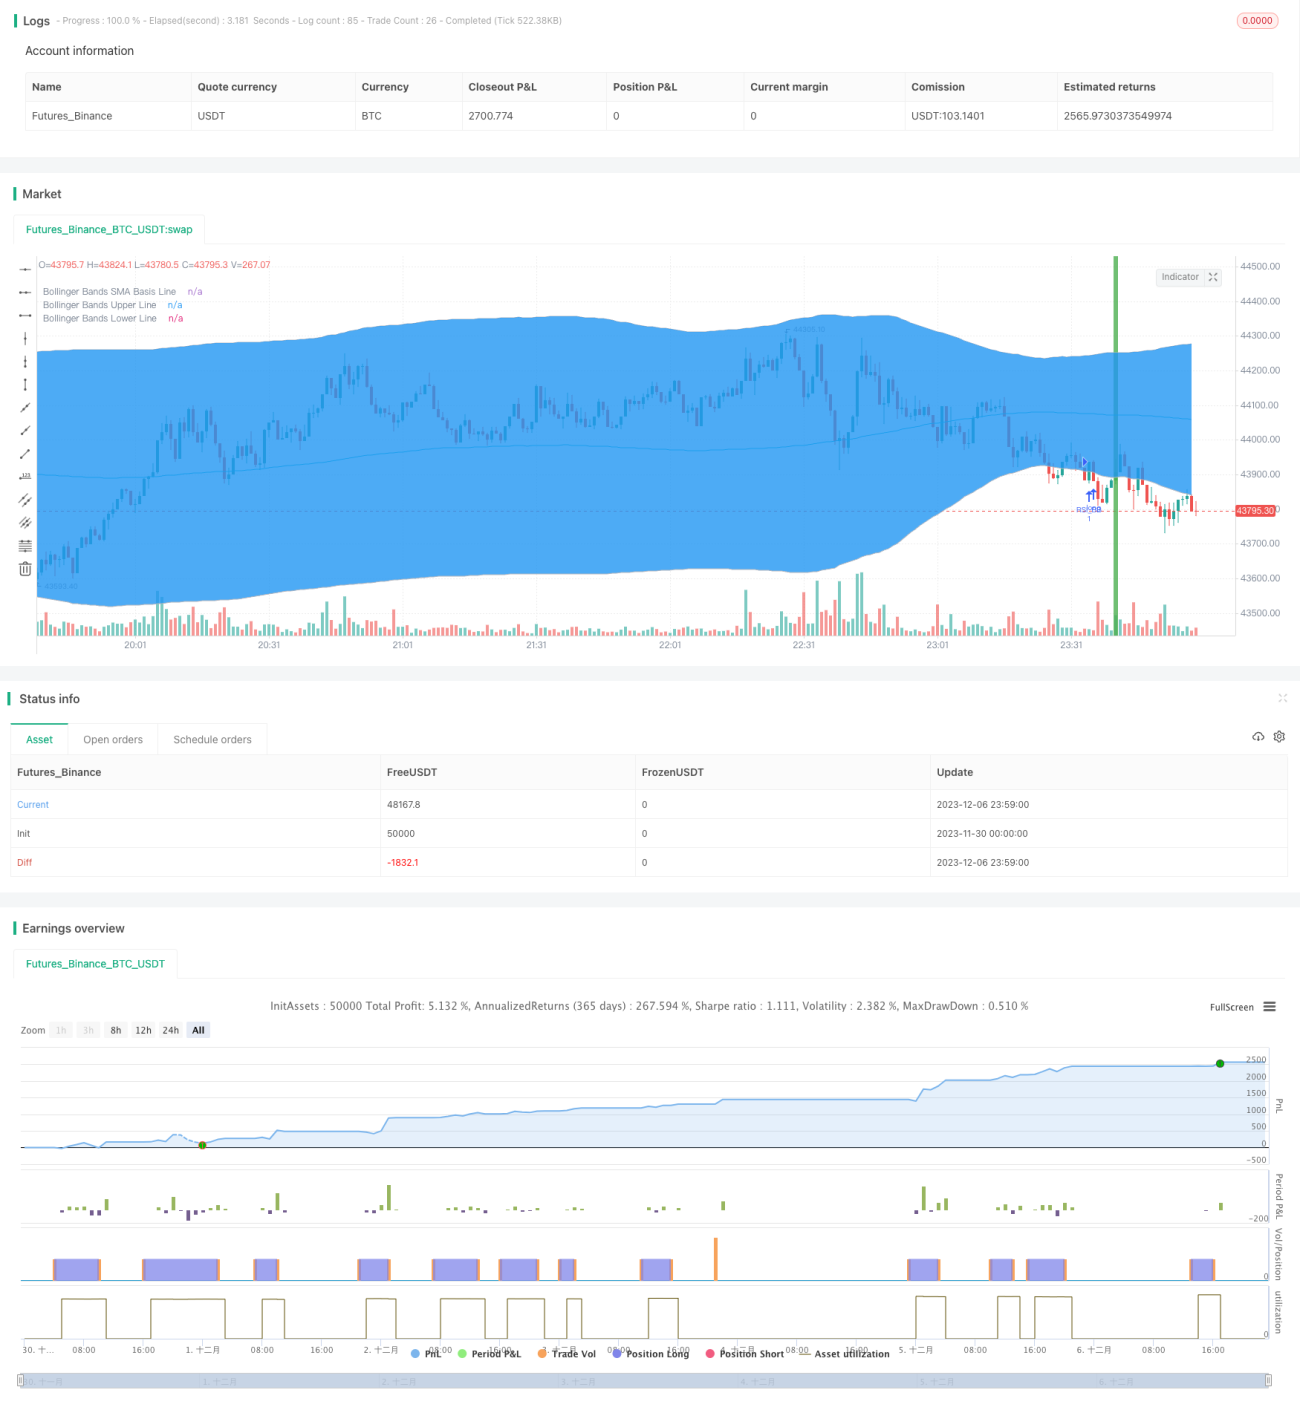
/*backtest
start: 2023-11-30 00:00:00
end: 2023-12-07 00:00:00
period: 1m
basePeriod: 1m
exchanges: [{"eid":"Futures_Binance","currency":"BTC_USDT"}]
*/

//@version=3
strategy("Bollinger + RSI, Double Strategy Long-Only (by ChartArt) v1.2", shorttitle="CA_-_RSI_Bol_Strat_1.2", overlay=true)

// ChartArt's RSI + Bollinger Bands, Double Strategy UPDATE: Long-Only- 1