Stratégie de trading de moyenne mobile MACD sur plusieurs périodes
Aperçu
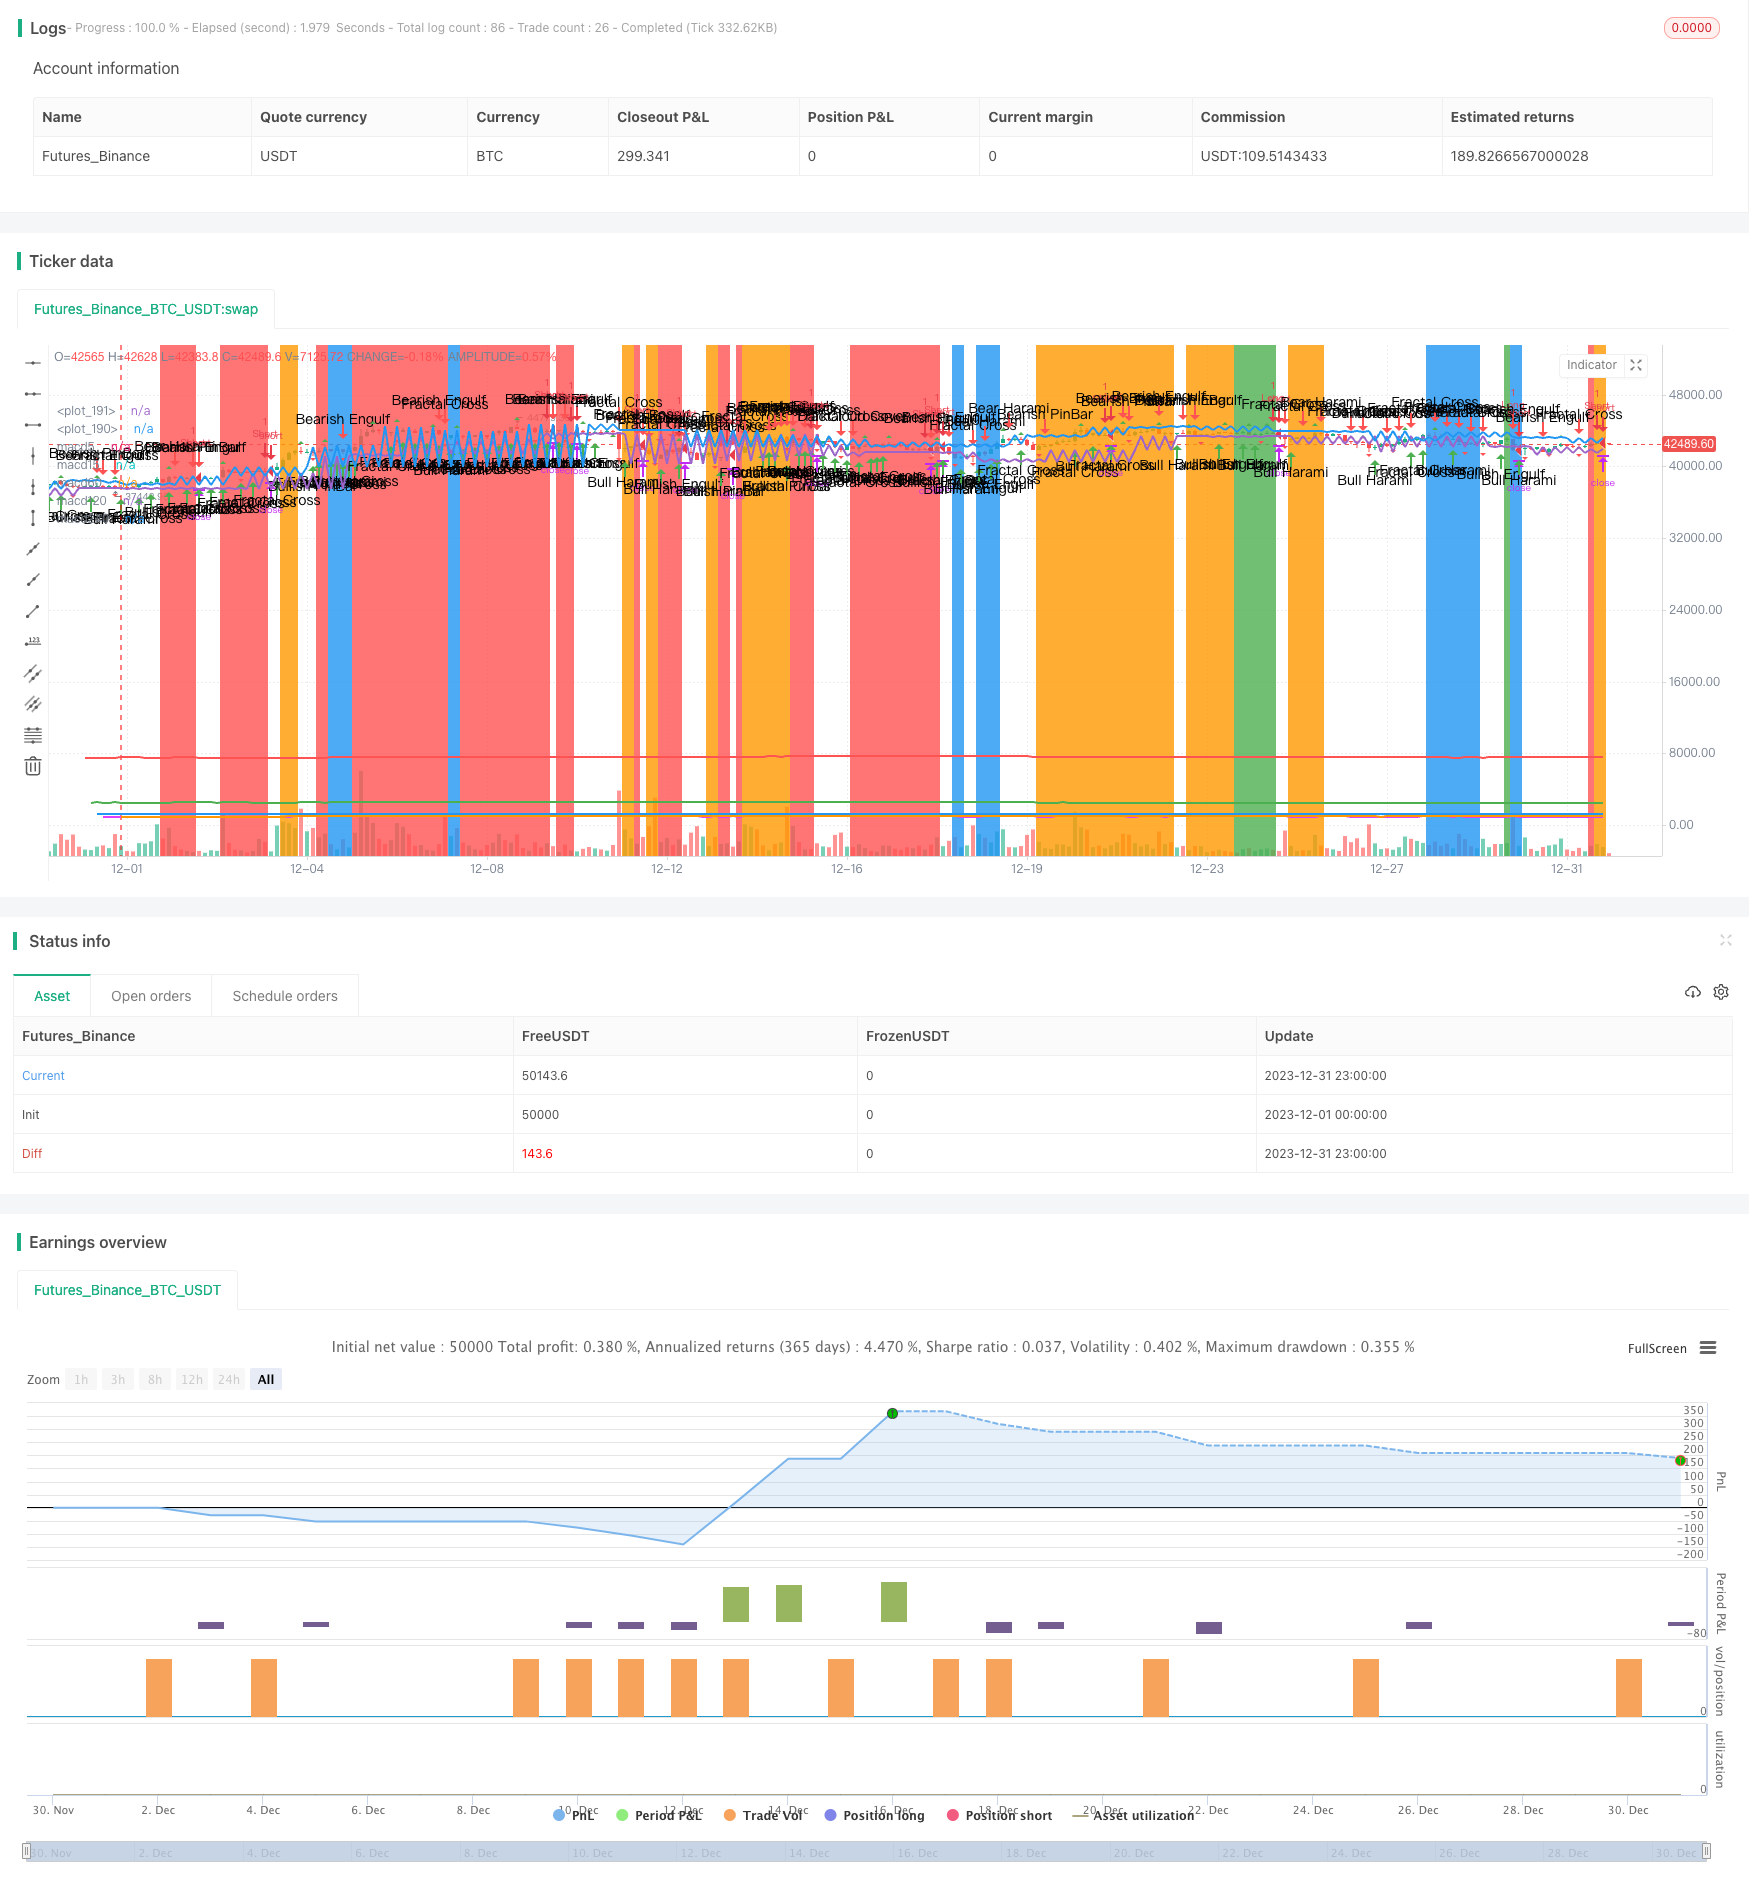
La stratégie est basée sur l’indicateur MACD et la courbe des moyennes de plusieurs périodes. Elle utilise la performance de l’indicateur MACD sur différentes périodes et la relation de la position du prix avec les différentes courbes moyennes, en concevant des règles d’entrée et de sortie pour les positions longues et courtes.
Principe de stratégie
1. Indicateur MACD
- Calculer les moyennes de 5 minutes, 15 minutes, 1 heure et 4 heures
- Jugez les tendances par la relation des prix aux différentes moyennes périodiques
2. Indicateur du RSI
- Calculer le RSI pour la période actuelle et la période ultérieure
- Utilisez le RSI pour juger de la hauteur et de la basse de la courbe
3. La forme K
- Calculer plusieurs combinaisons de faisceaux de rayons X et Y pour déterminer le signal de retour
- Le prix est un élément important du support et de la pression.
4. Règles d’entrée
Il y a plusieurs conditions:
- Le RSI est actuellement en baisse.
- Le bas de l’indicateur RSI à hautes périodes s’est éloigné, indiquant une reprise imminente
Conditions de mise à l’écart
- Le RSI a atteint un sommet cyclique
- L’indicateur RSI à hautes périodes a affiché une déviation supérieure, indiquant une inversion imminente
5. Règles de jeu
Les conditions sont les suivantes:
- Les lignes K donnent lieu à des signaux de retour: les tendances se retournent en lignes négatives, comme les étoiles lumineuses et les nuages sombres.
Conditions de l’aéroport:
- Les lignes K donnent lieu à des signaux de retour: les tendances se retournent vers les lignes du Soleil, comme les pieds de lumière et les énormes engloutissements.
6. Règles de contrôle du vent
Définir des critères de stop-loss et de stop-loss pour éviter l’expansion des pertes et la contraction des bénéfices.
Analyse des avantages
- Combinaison de plusieurs indicateurs, jugement global, précision du signal élevée
- Utiliser au mieux les informations des différents cycles pour améliorer la probabilité de profit
- Des règles strictes d’entrée et de sortie, des risques contrôlés
Risque et optimisation
- Une mauvaise optimisation des paramètres peut entraîner des transactions trop fréquentes
- Nécessité d’optimiser les paramètres de l’indicateur pour s’adapter aux différentes variétés
- Un arrêt de perte dynamique peut être configuré pour bloquer les gains
Résumer
La stratégie est globalement robuste et permet de mieux saisir les tendances du marché et d’éviter les risques de transaction grâce à des jugements multi-indicateurs et à des règles d’entrée et de sortie strictes. Cependant, des optimisations supplémentaires sont nécessaires pour améliorer la stabilité des gains.
/*backtest
start: 2023-12-01 00:00:00
end: 2023-12-31 23:59:59
period: 3h
basePeriod: 15m
exchanges: [{"eid":"Futures_Binance","currency":"BTC_USDT"}]
*/

//@version=2

//
// Author : Jacques CRETINON
// Last Version : V1.0 11-22-2016
//
// Risk disclaimer : Do not use this script in production environment. We assume no liability or responsibility for any damage to you, your computer, or your other property, due to the use of this script.
//
// Purpose of this script :
// 1- use same pine code for strategy or study script (with simple modifications)
// 2- be able to send alerts : enterlong, entershort, exitlong, exitshort, stoplosslong, stoplossshort, takeprofitlong, takeprofitshort in a study script like a strategy script should do
// 3- do not repaint (I HOPE)
//
// RoadMap :
// 1- manage : Trailing Stop Loss and Trailing Stop Loss offset
//
// I use this script :
// 1- with default value for XAUUSD, current chart resolution : 1mn, large timeframe : 15mn.
// 2- That's why I hard code MACD5 (5mn average), MACD15 (15mn average), MACD60 (1h average) ...
// 3- MACD, RSI (1mn and 15mn) and Candles info are my inputs to take any decisions
//
// I do not publish my enterLong, enterShort, exitLong and exitShort conditions (lines 204 to 207 are sample !) as they are not as perfect as I'd like. Fell free to use your own conditions :)
//
// Please, report me any bug, fell free to discuss and share. English is not my natural language, so be clement ;) Happy safe trading :)

// If you use this pine script as a
// * STRATEGY script => uncomment line 31 and lines 210 to 215 ; comment line 34 ; change value of study_script line 37 to false
// * STUDY    script => uncomment line 34 ; comment line 31 and lines 210 to 215 ; change value of study_script line 37 to true

// STRATEGY script => uncomment ; STUDY script => comment
strategy(title = "JC_MacD_RSI_Candle_Strat", shorttitle = "JMRCS", overlay = true)

// STUDY script => uncomment ; STRATEGY script => comment
//study(title="JC_MacD_RSI_Candle_Alert", shorttitle="JMRCA", precision=0, overlay = false )

// STUDY script => study_script = true ; STRATEGY script => study_script = false
study_script = false

useCurrentRes = input(false, title="Use Current Chart Resolution")
resCustom = input(title="Use Different Timeframe ? Uncheck Box Above",  defval='1')
res = useCurrentRes ? period : resCustom
largeTimeframe = input(title="Large timeframe ? ",  defval='15')

// Strategy Time limiting
useTimeLimit    = input(defval = true, title = "Use Start Time Limiter?")
startYear       = input(defval = 2016, title = "Start From Year",  minval = 0, step = 1)
startMonth      = input(defval = 11, title = "Start From Month",  minval = 0,step = 1)
startDay        = input(defval = 22, title = "Start From Day",  minval = 0,step = 1)
startHour       = input(defval = 00, title = "Start From Hour",  minval = 0,step = 1)
startMinute     = input(defval = 00, title = "Start From Minute",  minval = 0,step = 1)
inputTime   = timestamp(syminfo.timezone, startYear, startMonth, startDay, startHour, startMinute)
timeOk      = true

// when do we apply this script
run_script = (useTimeLimit and timeOk) or not useTimeLimit

// MACD strat
res_macd5_cur_close           = request.security(syminfo.tickerid, res,            sma(close   ,5 ))
res_macd15_cur_close          = request.security(syminfo.tickerid, res,            sma(close   ,15 ))
res_macd60_cur_close          = request.security(syminfo.tickerid, res,            sma(close   ,60 ))
res_macd120_cur_close         = request.security(syminfo.tickerid, res,            sma(close   ,120))
res_macd240_cur_close         = request.security(syminfo.tickerid, res,            sma(close   ,240))

// Plot MACD info
plot_macd = input(true, title="plot macd (only strategy script) ?")
plot(not study_script and run_script and plot_macd ? res_macd5_cur_close : na, title = "macd5", color = red, linewidth = 2, style = line, transp = 50)
plot(not study_script and run_script and plot_macd ? res_macd15_cur_close : na, title = "macd15", color = green, linewidth = 2, style = line, transp = 50)
plot(not study_script and run_script and plot_macd ? res_macd60_cur_close : na, title = "macd60", color = blue, linewidth = 2, style = line, transp = 50)
plot(not study_script and run_script and plot_macd ? res_macd120_cur_close : na, title = "macd120", color = fuchsia, linewidth = 2, style = line, transp = 50)
plot(not study_script and run_script and plot_macd ? res_macd240_cur_close : na, title = "macd240", color = orange, linewidth = 2, style = line, transp = 50)

// This section based on RSI strat from ChrisMoody 8/15/2014
plot_rsi = input(true, title="plot rsi info ? ")
len = input(14, minval=1, title="Length")
upLine = input(65, minval=50, maxval=90, title="Upper Line Value?")
lowLine = input(35, minval=10, maxval=50, title="Lower Line Value?")

// current Time Frame RSI
res_up_cur_close = rma(max(change(close), 0), len)
res_down_cur_close = rma(-min(change(close), 0), len)
res_rsi_cur_close = res_down_cur_close == 0 ? 100 : res_up_cur_close == 0 ? 0 : 100 - (100 / (1 + res_up_cur_close / res_down_cur_close))
res_outRSI_cur_close = request.security(syminfo.tickerid, res, res_rsi_cur_close)

res_aboveLine = res_outRSI_cur_close > upLine ? 1 : 0
res_belowLine = res_outRSI_cur_close < lowLine ? 1 : 0
res_crossUp = res_outRSI_cur_close[1] < lowLine and res_outRSI_cur_close > lowLine ? 1 : 0
res_crossDn = res_outRSI_cur_close[1] > upLine and res_outRSI_cur_close < upLine ? 1 : 0

// Large Time Frame RSI
ltf_up_cur_close = rma(max(change(close), 0), len)
ltf_down_cur_close = rma(-min(change(close), 0), len)
ltf_rsi_cur_close = ltf_down_cur_close == 0 ? 100 : ltf_up_cur_close == 0 ? 0 : 100 - (100 / (1 + ltf_up_cur_close / ltf_down_cur_close))
ltf_outRSI_cur_close = request.security(syminfo.tickerid, largeTimeframe, ltf_rsi_cur_close)

ltf_aboveLine = ltf_outRSI_cur_close > upLine ? 1 : 0
ltf_belowLine = ltf_outRSI_cur_close < lowLine ? 1 : 0
ltf_crossUp = ltf_outRSI_cur_close[1] < lowLine and ltf_outRSI_cur_close > lowLine ? 1 : 0
ltf_crossDn = ltf_outRSI_cur_close[1] > upLine and ltf_outRSI_cur_close < upLine ? 1 : 0

// Plot RSI info
bgcolor(run_script and plot_rsi and res_aboveLine ? red : na, transp=70)
bgcolor(run_script and plot_rsi and res_crossDn ? red : na, transp=40)
bgcolor(run_script and plot_rsi and res_belowLine ? green : na, transp=70)
bgcolor(run_script and plot_rsi and res_crossUp ? green : na, transp=40)
bgcolor(run_script and plot_rsi and ltf_aboveLine ? orange : na, transp=70)
bgcolor(run_script and plot_rsi and ltf_crossDn ? orange : na, transp=40)
bgcolor(run_script and plot_rsi and ltf_belowLine ? blue : na, transp=70)
bgcolor(run_script and plot_rsi and ltf_crossUp ? blue : na, transp=40)

// This section based on [RS]Fractal Levels  by RicardoSantos
plot_candle = input(true, title="plot all candle info (only strategy script) ?")
showfractals = input(true, title="plot fractals info (only strategy script) ?")
showlevels = input(true, title="plot level info (only strategy script) ?")

topfractal = high[2] > high[1] and high[2] > high and high[2] > high[3] and high[2] > high[4]
botfractal = low[2] < low[1] and low[2] < low and low[2] < low[3] and low[2] < low[4]
topfractals = topfractal ? high[2] : topfractals[1]
botfractals = botfractal ? low[2] : botfractals[1]
topfcolor = topfractals != topfractals[1] ? na : green
botfcolor = botfractals != botfractals[1] ? na : red

// This section based on "Candlestick Trend Indicator v0.5"  by JustUncleL Date: 12-Aug-2016  Version: v0.5on Almost Zero Lag EMA [LazyBear]
// PBar Percentages
pctP = input(66, minval=1, maxval=99, title="Directional PBars, % of Range of Candle the Long Wick Has To Be")
pctCp = pctP * .01

// Shaved Bars Percentages
pctS = input(5, minval=1, maxval=99, title="Shaved Bars, % of Range it Has To Close On The Lows or Highs")
pctCs = pctS * .01
pctSPO = pctCs

// range
range = high - low

// discard candle with a little body (addon by cretinon)
tradable_val = input(3, minval=-1, title="min body size factor ? WARNING see pine code to understand")
body = abs(open - close)
pbody = ((body  / max(high, low)) * 10000 ) > tradable_val ? true : false

// Reversal PinBars %
pctRP = input(72, minval=1, maxval=99, title="Reversal PBars, % of Range of Candle the Long Wick Has To Be")
pctCRp = pctRP * .01
pctCRPO = 1 - pctCRp

// Reversal Pin Bar Lookback Length
pblb =input(6,minval=1,title="Reversal Pin Bar Lookback Length")
pBarRUp = open > high - (range * pctCRPO) and close > high - (range * pctCRPO) and low <= lowest(pblb) ? 1 : 0
pBarRDn = open < high - (range *  pctCRp) and close < high-(range * pctCRp) and high >= highest(pblb) ? 1 : 0

// Shaved Bars filter to the MA50 line
sBarUp   = (close >= (high - (range * pctCs)))
sBarDown = (close <= (low + (range * pctCs)))

// Inside Bars
insideBarUp = (high < high[1] and low > low[1])
insideBarDn = (high < high[1] and low > low[1])
outsideBarUp= (high > high[1] and low < low[1])
outsideBarDn= (high > high[1] and low < low[1])

// Calculing candles info (only if body is not too small - by cretinon)
pBarDn = open < high - (range * pctCp) and close < high - (range * pctCp)
pBarUp = open > low + (range * pctCp) and close > low + (range * pctCp)
dcc = pbody and ((close[1]>open[1] and abs(close[1]-open[1])/range[1]>=0.7 and close<open and abs(close-open)/range>=0.7 and open>=close[1] and close>open[1] and close<((open[1]+close[1])/2)))
pln= pbody and ((close[1]<open[1] and abs(open[1]-close[1])/range[1]>=0.7 and close>open and abs(close-open)/range>=0.7 and open<=close[1] and close<open[1] and close>((open[1]+close[1])/2)))
beh = pbody and ((close[1] > open[1] and open > close and open <= close[1] and low >= open[1] and open - close < close[1] - open[1] and (high < high[1] and low > low[1])))
blh = pbody and ((open[1] > close[1] and close > open and close <= open[1] and high <= open[1] and close - open < open[1] - close[1] and (high < high[1] and low > low[1])))
bee = pbody and ((close[1] > open[1] and close < open and close<=low[1] and open>= close[1]))
ble = pbody and ((close[1] < open[1] and close > open and close >= high[1] and open<=close[1]))
blfr = pbody and (crossover(close,topfractals))
befr = pbody and (crossunder(close,botfractals))
// Hammer and Inverted Hammer rewrite by cretinon
pHammer = pbody and (pBarUp and (not pBarRUp and not pBarRDn)) ? true :false
pIHammer = pbody and (pBarDn and (not pBarRUp and not pBarRDn)) ? true : false

// Plot candle info
location_Bearish = not study_script ? location.abovebar : location.bottom
location_Bullish = not study_script ? location.belowbar : location.bottom
plotshape(run_script and plot_candle ? pIHammer : na, title= "Bearish Pin Bar",  color=red, style=shape.arrowdown, location=location_Bearish , text="Bearish\nPinBar")
plotshape(run_script and plot_candle and pHammer,  title= "Bullish Pin Bar", location=location_Bullish, color=green, style=shape.arrowup, text="Bullish\nPinBar")
plotshape(run_script and plot_candle and dcc, title="Dark Cloud Cover",text='DarkCloud\nCover',color=red, style=shape.arrowdown,location=location_Bearish)
plotshape(run_script and plot_candle and pln, title="Piercieng Line",text="Piercing\nLine",color=green, style=shape.arrowup,location=location_Bullish)
plotshape(run_script and plot_candle and beh and not dcc, title= "Bearish Harami",  color=red, style=shape.arrowdown,location=location_Bearish, text="Bear\nHarami")
plotshape(run_script and plot_candle and blh and not pln,  title= "Bullish Harami", location=location_Bullish, color=green, style=shape.arrowup, text="Bull\nHarami")
plotshape(run_script and plot_candle and bee, title= "Bearish Engulfing", color=red, style=shape.arrowdown, location=location_Bearish, text="Bearish\nEngulf")
plotshape(run_script and plot_candle and ble, title= "Bullish Engulfing", location=location_Bullish, color=green, style=shape.arrowup, text="Bullish\nEngulf")
plotshape(run_script and plot_candle and blfr and not ble and not blh and not sBarUp, title= "Bullish Fractal Cross", location=location_Bullish, color=green, style=shape.arrowup, text="Fractal\nCross")
plotshape(run_script and plot_candle and befr and not bee and not beh and not sBarDown,  title= "Bearish Fractal Cross", location=location_Bearish, color=red, style=shape.arrowdown, text="Fractal\nCross")
plotshape(run_script and showlevels ? topfractal : na, color=green, transp=0, style=shape.triangleup, location=location_Bearish, offset=-2, size=size.tiny)
plotshape(run_script and showfractals ? botfractal : na, color=red, transp=0, style=shape.triangledown, location=location_Bullish, offset=-2, size=size.tiny)
plot(study_script ? na : run_script and showlevels ? topfractals : na, color=topfcolor, transp=0, linewidth=2)
plot(study_script ? na : run_script and showfractals ? botfractals : na, color=botfcolor, transp=0, linewidth=2)

// Risk management
inpTakeProfit   = input(defval = 1500, title = "Take Profit", minval = 0)
inpStopLoss     = input(defval = 100, title = "Stop Loss", minval = 0)
inpTrailStop    = input(defval = 0, title = "Trailing Stop Loss", minval = 0)
inpTrailOffset  = input(defval = 0, title = "Trailing Stop Loss Offset", minval = 0)
useTakeProfit   = inpTakeProfit  >= 1 ? inpTakeProfit  : na
useStopLoss     = inpStopLoss    >= 1 ? inpStopLoss    : na
useTrailStop    = inpTrailStop   >= 1 ? inpTrailStop   : na
useTrailOffset  = inpTrailOffset >= 1 ? inpTrailOffset : na

// Condition to enter/exit short/long
enterLong =  (run_script) and res_crossUp
enterShort = (run_script) and res_crossDn
exitLong =   (run_script) and pIHammer
exitShort =  (run_script) and pHammer

// STRATEGY script => uncomment ; STUDY script => comment
strategy.entry( id = "Long", long = true, when = enterLong )
strategy.close( id = "Long", when = exitLong )
strategy.entry( id = "Short", long = false, when = enterShort )
strategy.close( id = "Short", when = exitShort )
strategy.exit("Exit Long", from_entry = "Long", profit = useTakeProfit, loss = useStopLoss, trail_points = useTrailStop, trail_offset = useTrailOffset)
strategy.exit("Exit Short", from_entry = "Short", profit = useTakeProfit, loss = useStopLoss, trail_points = useTrailStop, trail_offset = useTrailOffset)

// Transform strtegy to alert by cretinon
last_long_trade_value = enterLong[1] ? close[1] : last_long_trade_value[1]
last_short_trade_value = enterShort[1] ? close[1] : last_short_trade_value[1]
are_we_long  = exitLong[1]  ? false : enterLong[1]  ? true : enterShort[1] ? false : are_we_long[1]  and last_long_trade_value  + useTakeProfit/100 <= high[1] ? false : are_we_long[1]  and last_long_trade_value  - useStopLoss/100 >= low[1]  ? false : are_we_long[1]
are_we_short = exitShort[1] ? false : enterShort[1] ? true : enterLong[1]  ? false : are_we_short[1] and last_short_trade_value - useTakeProfit/100 >= low[1]  ? false : are_we_short[1] and last_short_trade_value + useStopLoss/100 <= high[1] ? false : are_we_short[1]
plot_info = (not are_we_long[2] and not are_we_short[2] and enterLong[1])  ? 1 : (not are_we_long[2] and not are_we_short[2] and enterShort[1]) ? 2 : (not are_we_long[2] and not are_we_short[2] and exitLong[1]) ? -1 : (not are_we_long[2] and not are_we_short[2] and exitShort[1]) ? -2 : (are_we_long[2] and enterLong[1]) ? -3 : (are_we_long[2] and enterShort[1]) ? 3 : (are_we_long[2] and exitLong[1]) ? 4 : (are_we_long[2] and exitShort[1]) ? -4 : (are_we_long[2] and last_long_trade_value  + useTakeProfit/100 <= high[1]) ? 5 : (are_we_long[2] and last_long_trade_value  - useStopLoss/100 >= low[1]) ? 6 :(are_we_short[2] and enterLong[1]) ? 7 : (are_we_short[2] and enterShort[1]) ? -5 : (are_we_short[2] and exitLong[1]) ? -6 : (are_we_short[2] and exitShort[1]) ? 8 : (are_we_short[2] and last_short_trade_value - useTakeProfit/100 >= low[1]) ? 9 : (are_we_short[2] and last_short_trade_value + useStopLoss/100 <= high[1]) ? 10 : -7

// plot : debbuging purpose
plot(study_script ? plot_info : na, title="plot_info", color=yellow, style=line, linewidth=4)

// alertcondition
// STRATEGY script => comment ; STUDY script => uncomment
alertcondition(plot_info == 1,title="enterLong", message="enterLong")
alertcondition(plot_info == 2,title="enterShort", message="enterShort")
alertcondition(plot_info == 3,title="enterShort", message="enterShort after Long")
alertcondition(plot_info == 4,title="exitLong", message="exitLong")
alertcondition(plot_info == 5,title="exitLong", message="TakeProfitLong")
alertcondition(plot_info == 6,title="exitLong", message="StopLossLong")
alertcondition(plot_info == 7,title="enterLong", message="enterLong after Short")
alertcondition(plot_info == 8,title="exitShort", message="exitShort")
alertcondition(plot_info == 9,title="exitShort", message="TakeProfitShort")
alertcondition(plot_info == 10,title="exitShort", message="StopLossShort")