Stratégie de suivi de l' éruption de Qullamaggie

Auteur:ChaoZhang est là., Date: 2024-01-31 17h06:36
Les étiquettes:

img

Résumé

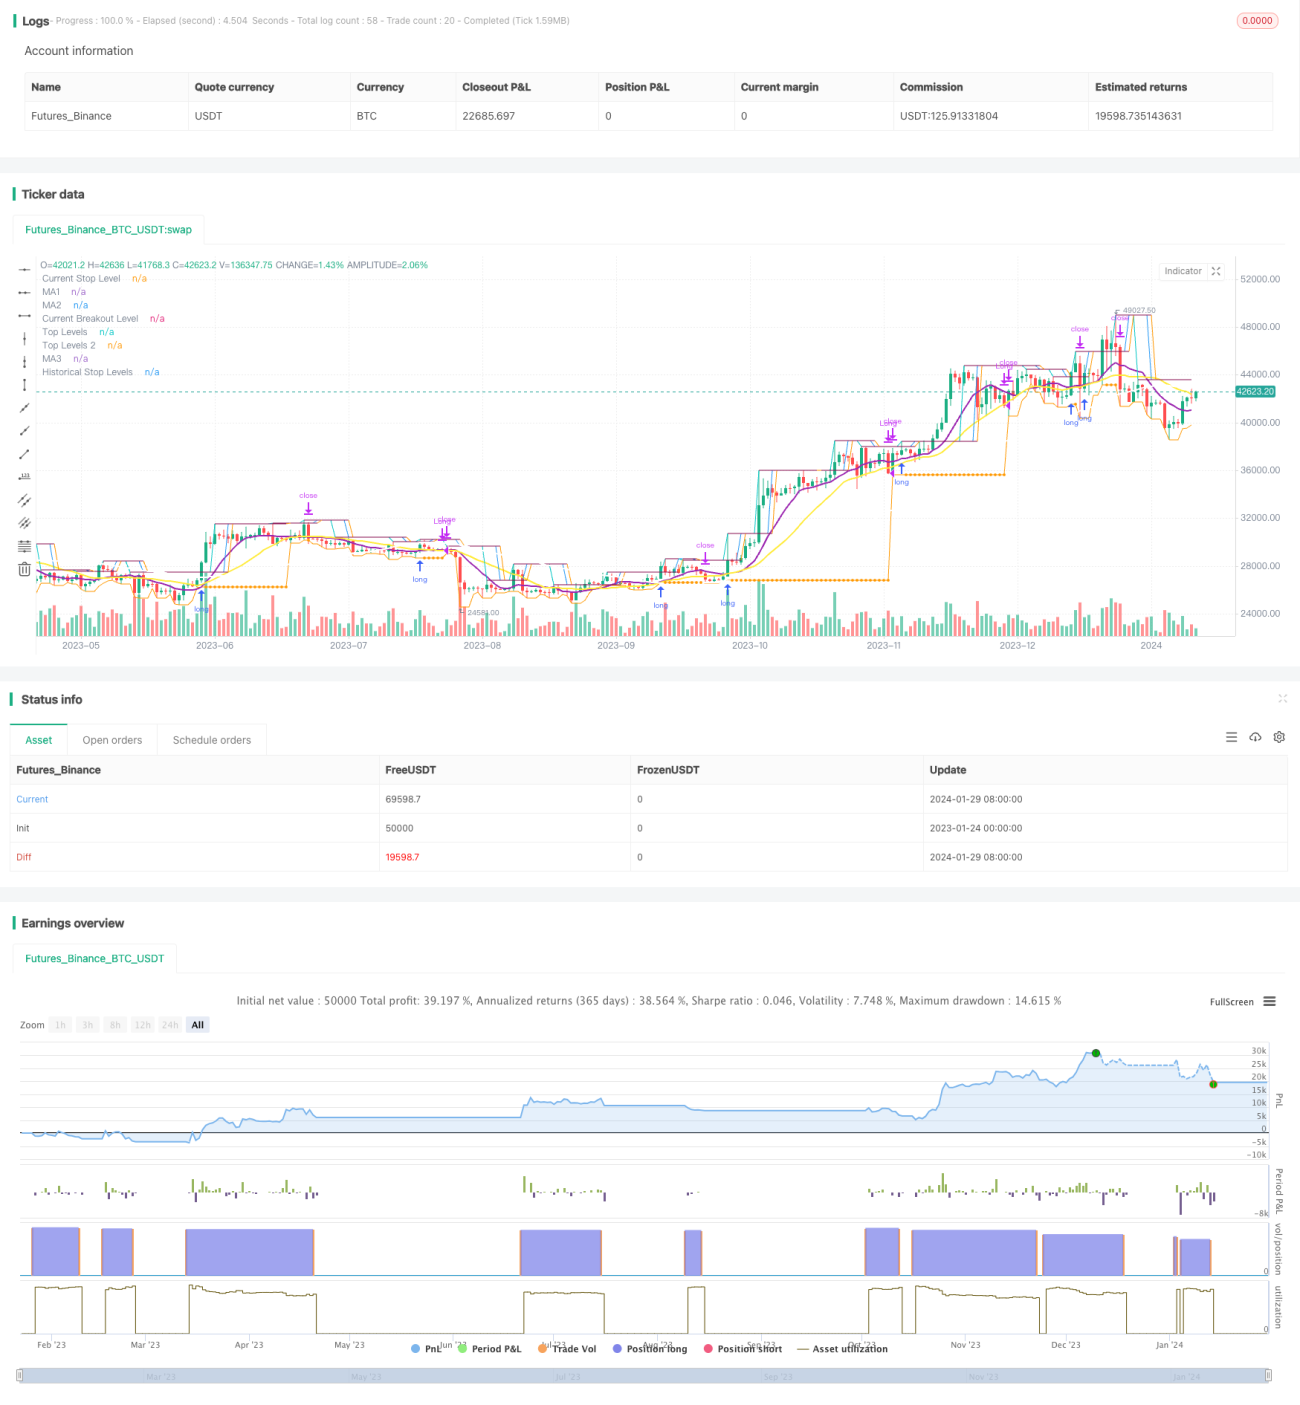
L'idée principale de cette stratégie est d'identifier la direction de la tendance sur une période plus longue et de trouver des points de rupture à entrer sur une période plus courte.

Principe de stratégie

Cette stratégie repose principalement sur trois indicateurs de jugement.

Tout d'abord, calculez un cycle plus long (comme le quotidien) moyenne mobile simple X-day. Permettez d'acheter uniquement lorsque le prix est au-dessus de cette moyenne mobile. Cela peut être utilisé pour déterminer la direction générale de la tendance et éviter les périodes d'oscillation du trading.

Deuxièmement, calculez le prix le plus élevé Swing High dans un cycle plus court (comme 5 jours). Lorsque le prix franchit ce prix le plus élevé, un signal d'achat est déclenché.

Troisièmement, établissez une ligne de stop loss. Après avoir entré dans la position, la ligne de stop loss est verrouillée au prix le plus bas une certaine période lbStop loin du point le plus bas récent. En même temps, définissez une ligne moyenne mobile (comme l'EMA de 10 jours sur le quotidien) comme mécanisme de sortie. Sortez de la position lorsque le prix est inférieur à cette ligne moyenne mobile.

La stratégie fixe également la valeur ATR pour éviter d'acheter des points sur-étendus.

Le jugement de l'interaction des trois indicateurs ci-dessus constitue la logique de base de cette stratégie.

Analyse des avantages

En tant que stratégie de suivi des évasions, elle présente les avantages suivants:

  1. Utilisez deux délais pour éviter d'être pris au piège de fausses ruptures dans les marchés oscillants.

  2. Utilisez les points de rupture formés par swing high. Ce type de rupture a une certaine inertie et est facile à suivre.

  3. La méthode d'arrêt de perte est relativement stricte, en suivant le point le plus bas le plus récent avec une certaine distance tampon pour éviter d'être rayé.

  4. Utiliser la moyenne mobile comme mécanisme de sortie pour réaliser des bénéfices flexibles en fonction des conditions du marché.

  5. L'indicateur ATR évite le risque de surendettement.

  6. Différentes combinaisons de paramètres peuvent être définies pour les tests, avec un grand espace d'optimisation.

Analyse des risques

La stratégie comporte également certains risques:

  1. Lorsque le prix oscille vers le haut et vers le bas autour de la ligne moyenne mobile, il est facile de basculer entre les positions d'entrée et de sortie.

  2. Lorsque le point de rupture est proche de la ligne de la moyenne mobile, il existe un risque de recul relativement élevé.

  3. Lorsqu'il n'y a pas de tendance évidente sur le marché, la durée de détention peut être trop longue, ce qui entraîne un risque temporel.

  4. Le paramètre ATR doit être réglé de manière raisonnable. Si ATR est trop faible, l'effet de filtrage est faible. S'il est trop grand, les possibilités d'entrée diminueront.

  5. Il est nécessaire de tester l'impact de différents paramètres de lb sur les résultats.

Réduction des risques:

  1. Ajustez les paramètres de la moyenne mobile de manière appropriée pour augmenter la capacité de filtrage.
  2. Optimiser les paramètres ATR, complétés par un jugement visuel.
  3. Ajustez la période de rétrospective pour trouver les paramètres optimaux.
  4. Suspendre les transactions pendant les marchés oscillants.

Directions d'optimisation

La stratégie peut également être optimisée dans les dimensions suivantes:

  1. Testez différentes combinaisons de paramètres de moyenne mobile pour trouver les paramètres optimaux.

  2. Essayez différents paramètres ATR pour équilibrer les opportunités d'entrée et le contrôle des risques.

  3. Optimiser le paramètre de la période de rétrospective de lb pour identifier des ruptures plus efficaces.

  4. Essayez de construire un stop loss dynamique basé sur la volatilité et le retrait pour contrôler le risque.

  5. Incorporer d'autres facteurs tels que le volume des transactions pour déterminer l'efficacité des ruptures.

  6. Développer/,< et d'autres méthodes pour trouver des points extrêmes comme références.

  7. Essayez Machine Learning pour former les paramètres pour les paramètres optimaux

Résumé

Dans l'ensemble, il s'agit d'une stratégie de suivi de rupture typique. À en juger par les doubles délais, l'utilisation de Swing High pour identifier le moment de l'entrée, et l'utilisation de la ligne de stop-loss et des mécanismes de sortie d'assurance à double moyenne mobile forment un système logique complet. Les caractéristiques de risque et de rendement de cette stratégie sont claires, adaptées aux investisseurs de suivi à moyen et long terme. Bien qu'il existe certains risques, ils peuvent être réduits en optimisant les paramètres et les règles. La stratégie a beaucoup de marge d'amélioration.


/*backtest
start: 2023-01-24 00:00:00
end: 2024-01-30 00:00:00
period: 1d
basePeriod: 1h
exchanges: [{"eid":"Futures_Binance","currency":"BTC_USDT"}]
*/

// This source code is subject to the terms of the Mozilla Public License 2.0 at https://mozilla.org/MPL/2.0/
// © millerrh

// The intent of this strategy is to buy breakouts with a tight stop on smaller timeframes in the direction of the longer term trend.
// Then use a trailing stop of a close below either the 10 MA or 20 MA (user choice) on that larger timeframe as the position 
// moves in your favor (i.e. whenever position price rises above the MA).
// Option of using daily ATR as a measure of finding contracting ranges and ensuring a decent risk/reward.
// (If the difference between the breakout point and your stop level is below a certain % of ATR, it could possibly find those consolidating periods.)

//@version=4
strategy("Qullamaggie Breakout", overlay=true, initial_capital=10000, currency='USD', 
   default_qty_type=strategy.percent_of_equity, default_qty_value=100, commission_type=strategy.commission.percent, commission_value=0.1)
   
// === BACKTEST RANGE ===
Start = input(defval = timestamp("01 Jan 2019 06:00 +0000"), title = "Backtest Start Date", type = input.time)
Finish = input(defval = timestamp("01 Jan 2100 00:00 +0000"), title = "Backtest End Date", type = input.time)

// Inputs
lb = input(defval = 3, title = "Lookback Period for Swing High", minval = 1,
   tooltip = "Lookback period for defining the breakout level.")
lbStop = input(defval = 3, title = "Lookback Bars for Stop Level", minval = 1,
   tooltip = "Initial stop placement is the lowest low this many bars back. Allows for tighter stop placement than referencing swing lows.")  
htf = input(defval="D", title="Timeframe of Moving Averages", type=input.resolution,
  tooltip = "Allows you to set a different time frame for the moving averages. The default behavior is to identify good tightening setups on a larger timeframe
  (like daily) and enter the trade on a breakout occuring on a smaller timeframe, using the moving averages of the larger timeframe to trail your stop.")
maType = input(defval="SMA", options=["EMA", "SMA"], title = "Moving Average Type")
ma1Length = input(defval = 10, title = "1st Moving Average Length", minval = 1)
ma2Length = input(defval = 20, title = "2nd Moving Average Length", minval = 1)
ma3Length = input(defval = 50, title = "3rd Moving Average Length", minval = 1)
useMaFilter = input(title = "Use 3rd Moving Average for Filtering?", type = input.bool, defval = true,
  tooltip = "Signals will be ignored when price is under this slowest moving average.  The intent is to keep you out of bear periods and only
             buying when price is showing strength or trading with the longer term trend.")
trailMaInput = input(defval="2nd Moving Average", options=["1st Moving Average", "2nd Moving Average"], title = "Trailing Stop")

// MA Calculations
ma(maType, src, length) =>
    maType == "EMA" ? ema(src, length) : sma(src, length) //Ternary Operator (if maType equals EMA, then do ema calc, else do sma calc)
ma1 = security(syminfo.tickerid, htf, ma(maType, close, ma1Length))
ma2 = security(syminfo.tickerid, htf, ma(maType, close, ma2Length))
ma3 = security(syminfo.tickerid, htf, ma(maType, close, ma3Length))

plot(ma1, color=color.purple, style=plot.style_line, title="MA1", linewidth=2, transp = 60)
plot(ma2, color=color.yellow, style=plot.style_line, title="MA2", linewidth=2, transp = 60)
plot(ma3, color=color.white, style=plot.style_line, title="MA3", linewidth=2, transp = 60)

// === USE ATR FOR FILTERING ===
// The idea here is that you want to buy in a consolodating range for best risk/reward. So here you can compare the current distance between 
// support/resistance vs.the ATR and make sure you aren't buying at a point that is too extended from normal.
useAtrFilter = input(title = "Use ATR for Filtering?", type = input.bool, defval = false,
  tooltip = "Signals will be ignored if the distance between support and resistance is larger than a user-defined percentage of Daily ATR. 
             This allows the user to ensure they are not buying something that is too extended and instead focus on names that are consolidating more.")
atrPerc = input(defval = 100, title = "% of Daily ATR Value", minval = 1)
atrValue = security(syminfo.tickerid, "D", atr(14))*atrPerc*.01

// === PLOT SWING HIGH/LOW AND MOST RECENT LOW TO USE AS STOP LOSS EXIT POINT ===
// Change these values to adjust the look back and look forward periods for your swing high/low calculations
pvtLenL = lb
pvtLenR = lb

// Get High and Low Pivot Points
pvthi_ = pivothigh(high, pvtLenL, pvtLenR)
pvtlo_ = pivotlow(low, pvtLenL, pvtLenR)

// Force Pivot completion before plotting.
Shunt = 1 //Wait for close before printing pivot? 1 for true 0 for flase
maxLvlLen = 0 //Maximum Extension Length
pvthi = pvthi_[Shunt]
pvtlo = pvtlo_[Shunt]

// Count How many candles for current Pivot Level, If new reset.
counthi = barssince(not na(pvthi))
countlo = barssince(not na(pvtlo))
 
pvthis = fixnan(pvthi)
pvtlos = fixnan(pvtlo)
hipc = change(pvthis) != 0 ? na : color.maroon
lopc = change(pvtlos) != 0 ? na : color.green

// Display Pivot lines
plot((maxLvlLen == 0 or counthi < maxLvlLen) ? pvthis : na, color=hipc, transp=0, linewidth=1, offset=-pvtLenR-Shunt, title="Top Levels")
// plot((maxLvlLen == 0 or countlo < maxLvlLen) ? pvtlos : na, color=lopc, transp=0, linewidth=1, offset=-pvtLenR-Shunt, title="Bottom Levels")
plot((maxLvlLen == 0 or counthi < maxLvlLen) ? pvthis : na, color=hipc, transp=0, linewidth=1, offset=0, title="Top Levels 2")
// plot((maxLvlLen == 0 or countlo < maxLvlLen) ? pvtlos : na, color=lopc, transp=0, linewidth=1, offset=0, title="Bottom Levels 2")

// BUY CONDITIONS
stopLevelCalc = valuewhen(pvtlo_, low[pvtLenR], 0) //Stop Level at Swing Low
buyLevel = valuewhen(pvthi_, high[pvtLenR], 0) //Buy level at Swing High
plot(buyLevel, style=plot.style_line, color=color.blue, title = "Current Breakout Level", show_last=1, linewidth=1, transp=50, trackprice=true)

// Conditions for entry and exit
stopLevel = float(na) // Define stop level here as "na" so that I can reference it in the inPosition 
  // variable and the ATR calculation before the stopLevel is actually defined.
buyConditions = (useMaFilter ? buyLevel > ma3 : true) and
  (useAtrFilter ? (buyLevel - stopLevel[1]) < atrValue : true)
// buySignal = high > buyLevel and buyConditions
buySignal = crossover(high, buyLevel) and buyConditions
trailMa = trailMaInput == "1st Moving Average" ? ma1 : ma2
sellSignal = crossunder(close, trailMa)
// sellSignal = security(syminfo.tickerid, htf, close < trailMa) and security(syminfo.tickerid, htf, close[1] < trailMa)


// STOP AND PRICE LEVELS
inPosition = bool(na)
inPosition := buySignal[1] ? true : sellSignal[1] ? false : low <= stopLevel[1] ? false : inPosition[1]

lowDefine = lowest(low, lbStop)
stopLevel := inPosition ? stopLevel[1] : lowDefine
// plot(stopLevel)

buyPrice = buyLevel
buyPrice := inPosition ? buyPrice[1] : buyLevel
plot(stopLevel, style=plot.style_line, color=color.orange, title = "Current Stop Level", show_last=1, linewidth=1, transp=50, trackprice=true)
plot(inPosition ? stopLevel : na, style=plot.style_circles, color=color.orange, title = "Historical Stop Levels", transp=50, trackprice=false)
// plot(buyPrice, style=plot.style_line, color=color.blue, linewidth=1, transp=50, trackprice=true)

// (STRATEGY ONLY) Comment out for Study
strategy.entry("Long", strategy.long, stop = buyLevel, when = buyConditions)
strategy.exit("Exit Long", from_entry = "Long", stop=stopLevel[1])
if (low[1] > trailMa)
    strategy.close("Long", when = sellSignal)
// if (low[1] > trailMa)
//     strategy.exit("Exit Long", from_entry = "Long", stop=trailMa) //to get this to work right, I need to reference highest highs instead of swing highs
    //because it can have me buy right back in after selling if the stop level is above the last registered swing high point.

Plus de