Strategi perdagangan dua arah berdasarkan indikator MACD

Ringkasan
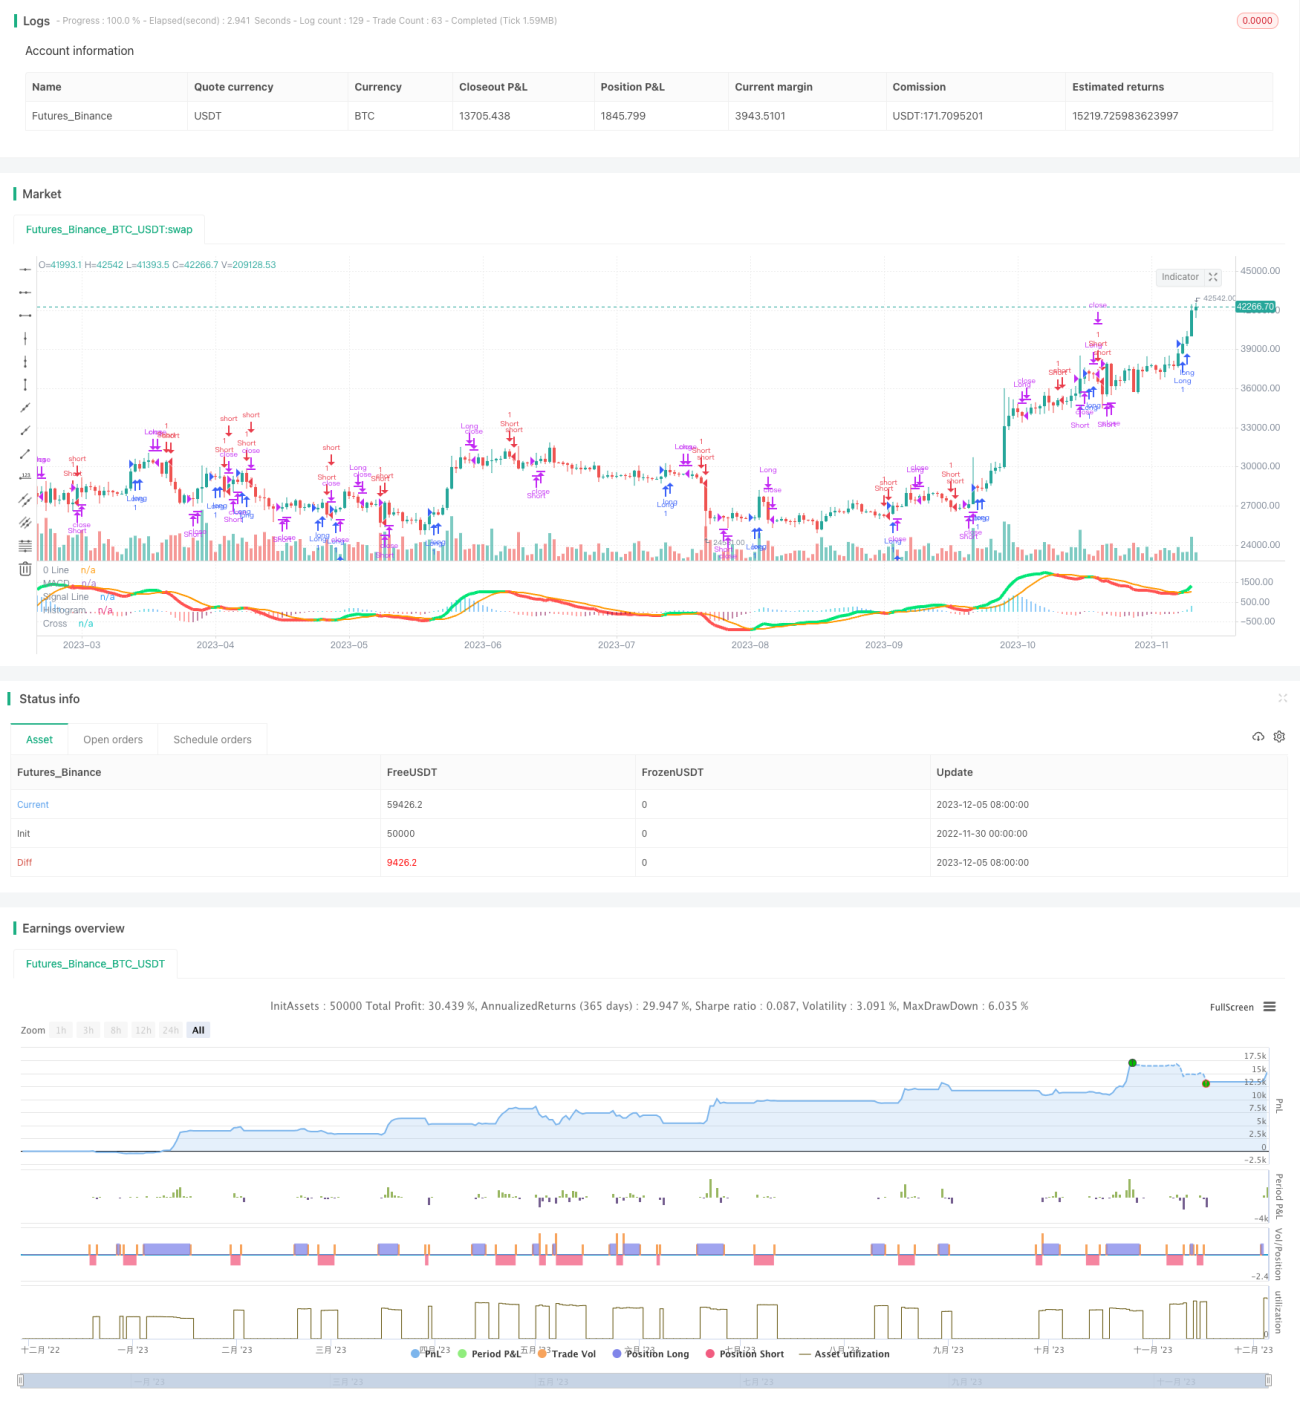
Strategi ini didasarkan pada indikator MACD untuk mewujudkan strategi perdagangan dua arah. Ini dapat melakukan over dan under pada indikator MACD pada forks emas dan forks mati, dan digabungkan dengan penilaian indikator lain untuk menyaring beberapa sinyal.
Prinsip Strategi
Strategi ini terutama menggunakan indikator MACD untuk melakukan perdagangan dua arah. Secara khusus, ia menghitung rata-rata bergerak cepat, rata-rata bergerak lambat dan garis sinyal MACD. Ini menghasilkan sinyal garpu emas ketika melewati rata-rata bergerak lambat di atas rata-rata bergerak cepat dan menghasilkan sinyal garpu mati ketika melewati rata-rata bergerak lambat di bawah rata-rata bergerak cepat.
Untuk menyaring beberapa sinyal tidak valid, strategi ini juga mengatur kisaran ± 30 sebagai filter, yang hanya akan memicu sinyal perdagangan jika garis pilar MACD melampaui kisaran ini. Selain itu, arah garis pilar MACD juga akan ditentukan pada saat posisi terdepan, hanya jika arah dua pilar berturut-turut berubah.
Keunggulan Strategis
- Menggunakan indikator MACD sebagai sinyal perdagangan utama, yang lebih sensitif terhadap pergerakan pasar saham dua arah
- Tambahkan filter untuk memfilter beberapa sinyal yang tidak valid
- Dengan menggunakan logika posisi terdepan yang menentukan arah dua pilar berturut-turut, dapat dihindari penembusan palsu sampai batas tertentu
Risiko Strategis
- Indikator MACD cenderung menghasilkan sinyal perdagangan yang sering, yang dapat menyebabkan frekuensi perdagangan yang terlalu tinggi
- Strategi indikator tunggal, sinyal yang sedikit tertunda dapat menyebabkan kerugian
- Logika posisi kosong untuk menilai arah garis pilar tidak cukup ketat, dan mungkin ada risiko kehilangan sinyal
Arah optimasi strategi
- Sinyal konfirmasi dapat dipertimbangkan dalam kombinasi dengan indikator lain, seperti indikator KDJ, indikator Brin, dll.
- Indikator lain yang lebih canggih dapat dipelajari untuk menggantikan MACD, seperti KD
- Anda dapat mengoptimalkan logika posisi terdepan, mengatur stop loss dan stop loss untuk mengendalikan kerugian tunggal.
Meringkaskan
Strategi ini secara keseluruhan merupakan strategi perdagangan dua arah yang dapat digunakan secara mendasar. Ini memanfaatkan keuntungan dari indikator MACD, tetapi juga menambahkan beberapa filter untuk mengontrol kualitas sinyal. Namun, indikator MACD itu sendiri juga memiliki beberapa masalah, dan masih perlu pengujian dan pengoptimalan lebih lanjut di pasar nyata untuk membuat strategi lebih dapat diandalkan. Secara keseluruhan, strategi ini meletakkan dasar untuk strategi perdagangan dua arah, yang dapat terus dioptimalkan di kemudian hari, menjadikannya sebagai strategi perdagangan kuantitatif yang kuat.
]
/*backtest
start: 2022-11-30 00:00:00
end: 2023-12-06 00:00:00
period: 1d
basePeriod: 1h
exchanges: [{"eid":"Futures_Binance","currency":"BTC_USDT"}]
*/

//@version=3

//Created by user ChrisMoody updated 4-10-2014
//Regular MACD Indicator with Histogram that plots 4 Colors Based on Direction Above and Below the Zero Line- 1