Strategi Mengikuti Terobosan


Tanggal Pembuatan: 2024-01-31 17:06:36 Akhirnya memodifikasi: 2024-01-31 17:06:36
menyalin: 0 Jumlah klik: 1280
1
fokus pada
1617
Pengikut

Strategi Mengikuti Terobosan

Ringkasan

Gagasan utama dari strategi ini adalah untuk mengidentifikasi arah tren pada jangka waktu yang lebih besar dan menemukan titik masuk terobosan pada jangka waktu yang lebih kecil, sementara stop loss exit melacak rata-rata bergerak pada jangka waktu yang lebih besar.

Prinsip Strategi

Strategi ini didasarkan pada tiga indikator utama:

Pertama, menghitung rata-rata bergerak sederhana X hari untuk periode yang lebih panjang (seperti garis matahari), dan hanya mengizinkan pembelian saat rata-rata bergerak tersebut berada di posisi harga. Ini dapat digunakan untuk mengetahui arah tren keseluruhan dan menghindari periode getaran perdagangan.

Kedua, menghitung harga tertinggi dalam periode yang lebih pendek (misalnya 5 hari) Swing High, yang memicu sinyal beli ketika harga melampaui harga tertinggi tersebut. Di sini digabungkan dengan parameter siklus lb untuk mencari titik penembusan yang sesuai.

Ketiga, membuat stop loss line. Setelah memasuki posisi, stop loss line terkunci pada harga terendah untuk periode tertentu lbStop dari titik terendah terdekat. Pada saat yang sama, mengatur moving average (seperti 10-hari EMA) sebagai mekanisme keluar, dan keluar dari posisi ketika harga lebih rendah dari moving average.

Strategi ini juga menetapkan nilai ATR untuk menghindari pembelian poin yang terlalu besar. Selain itu, ada kondisi tambahan lainnya seperti rentang waktu pengukuran.

Pertimbangan dari interaksi antara ketiga indikator tersebut membentuk logika inti dari strategi tersebut.

Analisis Keunggulan Strategi

Ini adalah strategi tracking yang inovatif, dengan beberapa keuntungan:

  1. Gunakan dua frame waktu untuk menghindari terjerat dalam pasar yang bergoyang. Frame waktu yang lebih panjang untuk menilai tren keseluruhan, dan frame waktu yang lebih pendek untuk mencari titik masuk tertentu.

  2. Terobosan ini memiliki inersia tertentu dan mudah untuk dilacak. Pada saat yang sama, melihat kembali parameter lb dapat disesuaikan untuk menemukan terobosan yang benar-benar efektif.

  3. Stop loss lebih ketat, melacak titik terendah terbaru dan meninggalkan jarak penyangga untuk menghindari penarikan.

  4. Menggunakan Moving Average sebagai mekanisme exit, stop-loss dapat dilakukan secara fleksibel sesuai situasi.

  5. Indikator ATR menghindari risiko yang ditimbulkan oleh pelepasan berlebihan.

  6. Anda dapat mengatur kombinasi parameter yang berbeda untuk menguji efek, ruang yang lebih besar untuk optimasi.

Analisis risiko

Strategi ini juga memiliki beberapa risiko:

  1. Ketika harga bergejolak di sekitar Moving Average, maka Anda akan sering bertukar posisi masuk dan keluar. Anda akan menghadapi risiko biaya yang lebih tinggi.

  2. Jika Anda melakukan breakout di dekat Moving Average, Anda akan menghadapi risiko penarikan yang lebih besar. Ini adalah karakteristik strategi itu sendiri.

  3. Ketika tidak ada tren yang jelas, jangka waktu yang terlalu lama dapat menyebabkan risiko waktu.

  4. Parameter ATR harus diatur secara wajar. ATR terlalu kecil akan mengurangi efek penyaringan, dan terlalu besar akan mengurangi peluang masuk.

  5. Perlu untuk menguji dampak dari parameter lb yang berbeda pada hasil. Parameter yang terlalu besar akan kehilangan beberapa peluang, parameter yang terlalu kecil dapat mengidentifikasi terobosan palsu.

Solusi untuk Mengatasi Risiko:

  1. Penyesuaian parameter rata-rata bergerak untuk meningkatkan efek filter.
  2. Optimalkan parameter ATR dan pertimbangan visual.
  3. Perbaiki kembali siklus lb untuk mencari parameter optimal.
  4. “Kami tidak akan melakukan apa-apa”, kata dia.

Arah optimasi strategi

Strategi ini juga dapat dioptimalkan dari dimensi-dimensi berikut:

  1. Uji berbagai kombinasi parameter moving average untuk mencari parameter optimal.

  2. Cobalah pengaturan parameter ATR yang berbeda untuk menyeimbangkan peluang masuk dan kontrol risiko.

  3. Optimalkan kembali parameter siklus lb untuk mengidentifikasi terobosan yang lebih efisien.

  4. Cobalah untuk membangun stop loss dinamis, dengan risiko kontrol berdasarkan volatilitas dan penarikan.

  5. Efektivitas terobosan ini dinilai dengan faktor-faktor lain seperti volume transaksi.

  6. Mengembangkan metode untuk mencari titik ekstrim sebagai referensi.

  7. Cobalah Machine Learning untuk melatih parameter untuk mendapatkan parameter yang optimal

Meringkaskan

Strategi ini secara keseluruhan adalah strategi pelacakan terobosan yang khas. Pertimbangan kerangka waktu ganda, Swing High mengidentifikasi waktu masuk, stop loss, dan mekanisme keluar dari moving average, membentuk sistem logis yang lengkap. Strategi ini memiliki karakteristik risiko dan keuntungan yang lebih jelas, cocok untuk investor dengan jenis pelacakan garis panjang dan menengah.
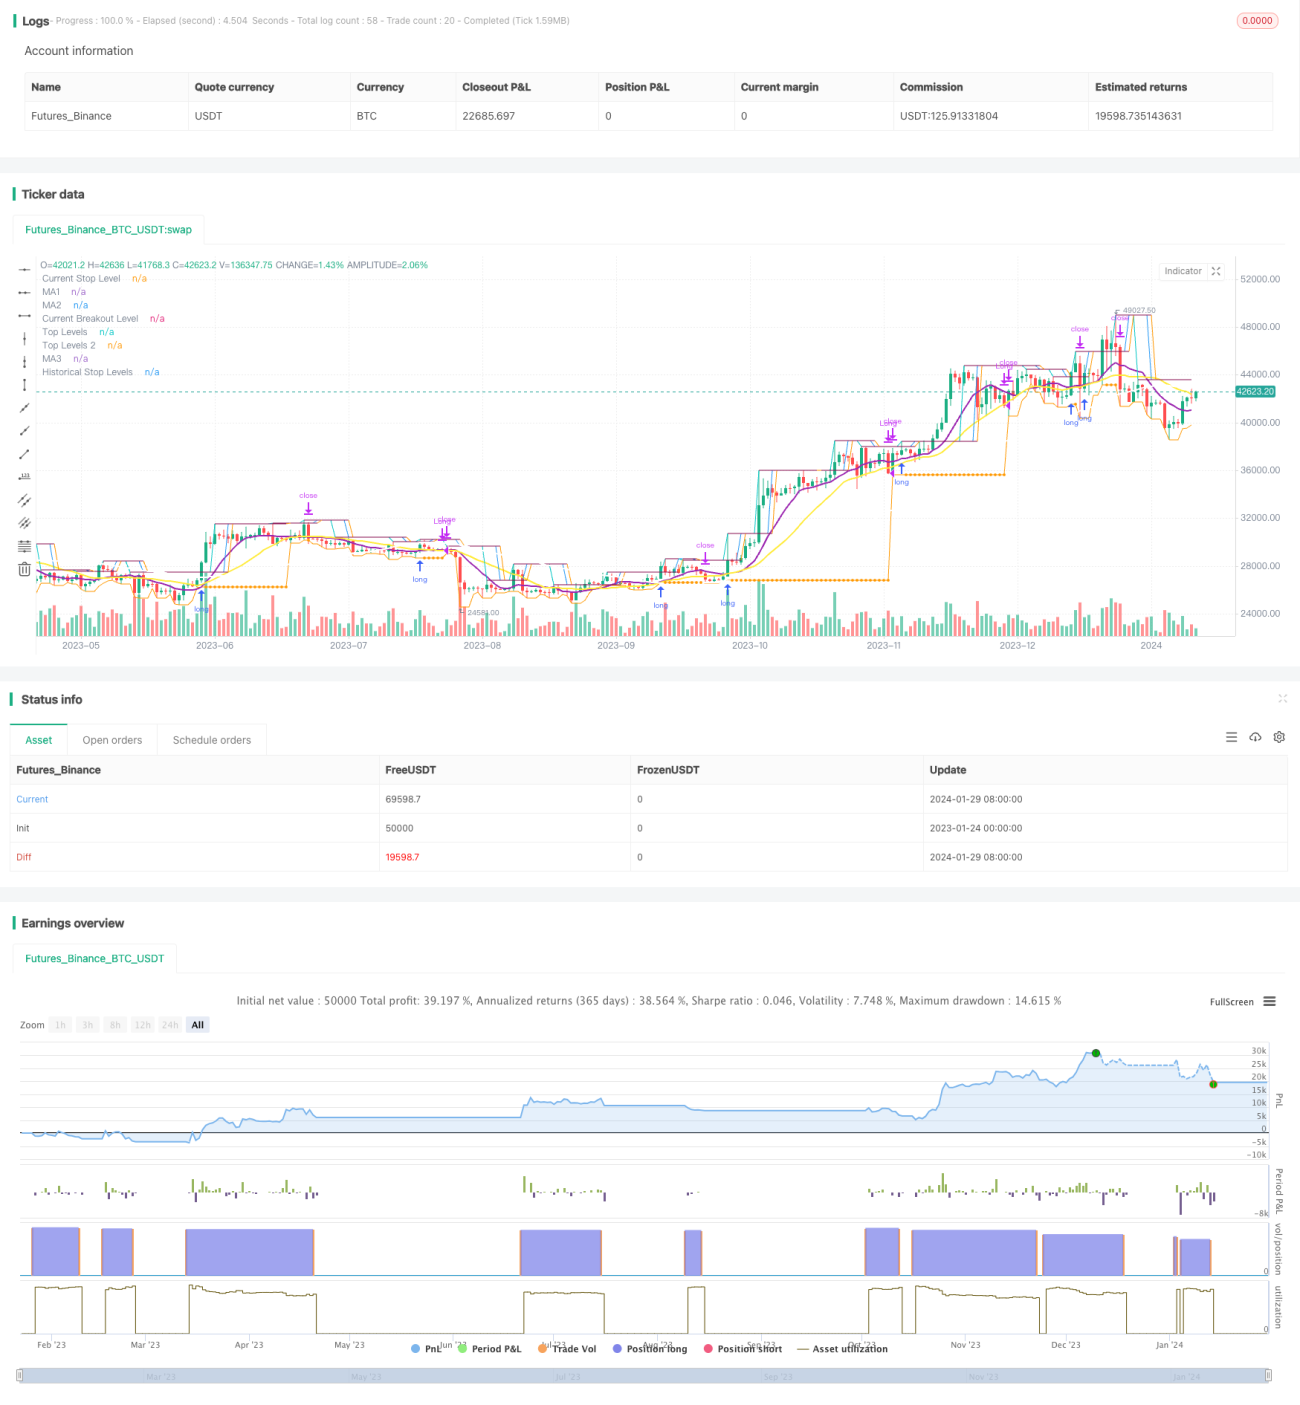
Kode Sumber Strategi
/*backtest
start: 2023-01-24 00:00:00
end: 2024-01-30 00:00:00
period: 1d
basePeriod: 1h
exchanges: [{"eid":"Futures_Binance","currency":"BTC_USDT"}]
*/

// This source code is subject to the terms of the Mozilla Public License 2.0 at https://mozilla.org/MPL/2.0/
// © millerrh

// The intent of this strategy is to buy breakouts with a tight stop on smaller timeframes in the direction of the longer term trend.
// Then use a trailing stop of a close below either the 10 MA or 20 MA (user choice) on that larger timeframe as the position 
// moves in your favor (i.e. whenever position price rises above the MA).
// Option of using daily ATR as a measure of finding contracting ranges and ensuring a decent risk/reward.
// (If the difference between the breakout point and your stop level is below a certain % of ATR, it could possibly find those consolidating periods.)

//@version=4
strategy("Qullamaggie Breakout", overlay=true, initial_capital=10000, currency='USD', 
   default_qty_type=strategy.percent_of_equity, default_qty_value=100, commission_type=strategy.commission.percent, commission_value=0.1)
   
// === BACKTEST RANGE ===
Start = input(defval = timestamp("01 Jan 2019 06:00 +0000"), title = "Backtest Start Date", type = input.time)
Finish = input(defval = timestamp("01 Jan 2100 00:00 +0000"), title = "Backtest End Date", type = input.time)

// Inputs
lb = input(defval = 3, title = "Lookback Period for Swing High", minval = 1,
   tooltip = "Lookback period for defining the breakout level.")
lbStop = input(defval = 3, title = "Lookback Bars for Stop Level", minval = 1,
   tooltip = "Initial stop placement is the lowest low this many bars back. Allows for tighter stop placement than referencing swing lows.")  
htf = input(defval="D", title="Timeframe of Moving Averages", type=input.resolution,
  tooltip = "Allows you to set a different time frame for the moving averages. The default behavior is to identify good tightening setups on a larger timeframe
  (like daily) and enter the trade on a breakout occuring on a smaller timeframe, using the moving averages of the larger timeframe to trail your stop.")
maType = input(defval="SMA", options=["EMA", "SMA"], title = "Moving Average Type")
ma1Length = input(defval = 10, title = "1st Moving Average Length", minval = 1)
ma2Length = input(defval = 20, title = "2nd Moving Average Length", minval = 1)
ma3Length = input(defval = 50, title = "3rd Moving Average Length", minval = 1)
useMaFilter = input(title = "Use 3rd Moving Average for Filtering?", type = input.bool, defval = true,
  tooltip = "Signals will be ignored when price is under this slowest moving average.  The intent is to keep you out of bear periods and only
             buying when price is showing strength or trading with the longer term trend.")
trailMaInput = input(defval="2nd Moving Average", options=["1st Moving Average", "2nd Moving Average"], title = "Trailing Stop")

// MA Calculations
ma(maType, src, length) =>
    maType == "EMA" ? ema(src, length) : sma(src, length) //Ternary Operator (if maType equals EMA, then do ema calc, else do sma calc)
ma1 = security(syminfo.tickerid, htf, ma(maType, close, ma1Length))
ma2 = security(syminfo.tickerid, htf, ma(maType, close, ma2Length))
ma3 = security(syminfo.tickerid, htf, ma(maType, close, ma3Length))

plot(ma1, color=color.purple, style=plot.style_line, title="MA1", linewidth=2, transp = 60)
plot(ma2, color=color.yellow, style=plot.style_line, title="MA2", linewidth=2, transp = 60)
plot(ma3, color=color.white, style=plot.style_line, title="MA3", linewidth=2, transp = 60)

// === USE ATR FOR FILTERING ===
// The idea here is that you want to buy in a consolodating range for best risk/reward. So here you can compare the current distance between 
// support/resistance vs.the ATR and make sure you aren't buying at a point that is too extended from normal.
useAtrFilter = input(title = "Use ATR for Filtering?", type = input.bool, defval = false,
  tooltip = "Signals will be ignored if the distance between support and resistance is larger than a user-defined percentage of Daily ATR. 
             This allows the user to ensure they are not buying something that is too extended and instead focus on names that are consolidating more.")
atrPerc = input(defval = 100, title = "% of Daily ATR Value", minval = 1)
atrValue = security(syminfo.tickerid, "D", atr(14))*atrPerc*.01

// === PLOT SWING HIGH/LOW AND MOST RECENT LOW TO USE AS STOP LOSS EXIT POINT ===
// Change these values to adjust the look back and look forward periods for your swing high/low calculations
pvtLenL = lb
pvtLenR = lb

// Get High and Low Pivot Points
pvthi_ = pivothigh(high, pvtLenL, pvtLenR)
pvtlo_ = pivotlow(low, pvtLenL, pvtLenR)

// Force Pivot completion before plotting.
Shunt = 1 //Wait for close before printing pivot? 1 for true 0 for flase
maxLvlLen = 0 //Maximum Extension Length
pvthi = pvthi_[Shunt]
pvtlo = pvtlo_[Shunt]

// Count How many candles for current Pivot Level, If new reset.
counthi = barssince(not na(pvthi))
countlo = barssince(not na(pvtlo))
 
pvthis = fixnan(pvthi)
pvtlos = fixnan(pvtlo)
hipc = change(pvthis) != 0 ? na : color.maroon
lopc = change(pvtlos) != 0 ? na : color.green

// Display Pivot lines
plot((maxLvlLen == 0 or counthi < maxLvlLen) ? pvthis : na, color=hipc, transp=0, linewidth=1, offset=-pvtLenR-Shunt, title="Top Levels")
// plot((maxLvlLen == 0 or countlo < maxLvlLen) ? pvtlos : na, color=lopc, transp=0, linewidth=1, offset=-pvtLenR-Shunt, title="Bottom Levels")
plot((maxLvlLen == 0 or counthi < maxLvlLen) ? pvthis : na, color=hipc, transp=0, linewidth=1, offset=0, title="Top Levels 2")
// plot((maxLvlLen == 0 or countlo < maxLvlLen) ? pvtlos : na, color=lopc, transp=0, linewidth=1, offset=0, title="Bottom Levels 2")

// BUY CONDITIONS
stopLevelCalc = valuewhen(pvtlo_, low[pvtLenR], 0) //Stop Level at Swing Low
buyLevel = valuewhen(pvthi_, high[pvtLenR], 0) //Buy level at Swing High
plot(buyLevel, style=plot.style_line, color=color.blue, title = "Current Breakout Level", show_last=1, linewidth=1, transp=50, trackprice=true)

// Conditions for entry and exit
stopLevel = float(na) // Define stop level here as "na" so that I can reference it in the inPosition 
  // variable and the ATR calculation before the stopLevel is actually defined.
buyConditions = (useMaFilter ? buyLevel > ma3 : true) and
  (useAtrFilter ? (buyLevel - stopLevel[1]) < atrValue : true)
// buySignal = high > buyLevel and buyConditions
buySignal = crossover(high, buyLevel) and buyConditions
trailMa = trailMaInput == "1st Moving Average" ? ma1 : ma2
sellSignal = crossunder(close, trailMa)
// sellSignal = security(syminfo.tickerid, htf, close < trailMa) and security(syminfo.tickerid, htf, close[1] < trailMa)


// STOP AND PRICE LEVELS
inPosition = bool(na)
inPosition := buySignal[1] ? true : sellSignal[1] ? false : low <= stopLevel[1] ? false : inPosition[1]

lowDefine = lowest(low, lbStop)
stopLevel := inPosition ? stopLevel[1] : lowDefine
// plot(stopLevel)

buyPrice = buyLevel
buyPrice := inPosition ? buyPrice[1] : buyLevel
plot(stopLevel, style=plot.style_line, color=color.orange, title = "Current Stop Level", show_last=1, linewidth=1, transp=50, trackprice=true)
plot(inPosition ? stopLevel : na, style=plot.style_circles, color=color.orange, title = "Historical Stop Levels", transp=50, trackprice=false)
// plot(buyPrice, style=plot.style_line, color=color.blue, linewidth=1, transp=50, trackprice=true)

// (STRATEGY ONLY) Comment out for Study
strategy.entry("Long", strategy.long, stop = buyLevel, when = buyConditions)
strategy.exit("Exit Long", from_entry = "Long", stop=stopLevel[1])
if (low[1] > trailMa)
    strategy.close("Long", when = sellSignal)
// if (low[1] > trailMa)
//     strategy.exit("Exit Long", from_entry = "Long", stop=trailMa) //to get this to work right, I need to reference highest highs instead of swing highs
    //because it can have me buy right back in after selling if the stop level is above the last registered swing high point.