
この戦略は,トレンド追跡逆転戦略とエルス先導指標戦略の組み合わせで,より信頼性の高い取引シグナルを得ることを目的としている.トレンド追跡逆転戦略は,トレンド逆転点を判断し,エルス先導指標戦略は,周期的な転換点を判断する.組合せシグナルは,市場への入場時間をより正確に判断する.
この戦略は,ウルフ・ジェンセン著の『将来市場での資金の三倍化』の183ページに由来している.これは,逆転型の戦略である.閉盘価格が前日の閉盘価格より2日連続で高く,そして9日目のストキャスティック・スローラインが50を下回ったとき,多めに作る.閉盘価格が前日の閉盘価格より2日連続で低く,そして9日目のストキャスティック・スローラインが50を下回ったとき,空っぽにする.
この戦略は,1日間のデータを用いて,1日間のトレンドダウン合成価格 (Detrended Synthetic Price, DSP) と日間のエラーズ先導指標 (Ehlers Leading Indicator, ELI) を描画する.DSPは価格支配周期を捉え,計算方法は2段階のバットワース波減去3段階の波である.ELIは周期転換点を事前に指示し,計算方法はトレンドダウン合成価格減去の単純移動平均である.ELIはトレンドダウン合成価格を横切る時に買い売りシグナルを生む.
この組み合わせ戦略の最大の利点は,トレンド反転判断と周期的な転向判断を組み合わせることで,取引信号がより信頼性があることである.トレンド反転戦略は,上下軌道に突入するトレンド反転点を判断することができる.エルス先導指標は,周期的な低谷と高点を事前に指示することができる.両者は,市場への入場時間をより正確に捉えることができる.
もう一つの利点は,パラメータの調整の柔軟性である.トレンド逆転戦略の株式指数パラメータは,市場に応じて調整することができる.エルレス先導指標の周期長さも,異なる周期に対応して調整することができる.
この策略の最大のリスクは,トレンドの持続を逃すことである. 策略が反転信号の出現を待つために入場するので,早期の強いトレンドの段階を逃す可能性がある. さらに,反転信号は偽の突破であり,セットされることも可能である.
解決策は,パラメータを調整し,反転判断周期を短縮し,トレンドの反転を間に合うように捕捉することです.また,損失を制御するためにストップを導入することもできます.
この戦略は以下の点で最適化できます.
単発損失を抑えるために,ストップ・損失戦略を導入する.
パラメータを最適化し,反転信号周期を調整し,異なる市場環境に適応する.
他の指標のフィルタを追加し,信号の質を向上させ,偽信号を減らす.
資金管理モジュールを追加し,全体のポジションとリスクを制御します.
異なる品種のパラメータの効果をテストし,どの品種に最適化するか.
機械学習モジュールを追加し,パラメータを自律的に調整できるようにした.
この戦略は,トレンド反転判断と周期的な転換判断を組み合わせて,市場への入場時間をより確実に把握できます.最大の利点は,信号の質が良好で,調整性が強いことです.最大のリスクは,パラメータの調整,ストップによって制御できる初期のトレンドを逃すことです.将来,ストップ,パラメータの最適化,信号フィルタなどの面で改善することができ,戦略を異なる市場環境により適応させることができます.
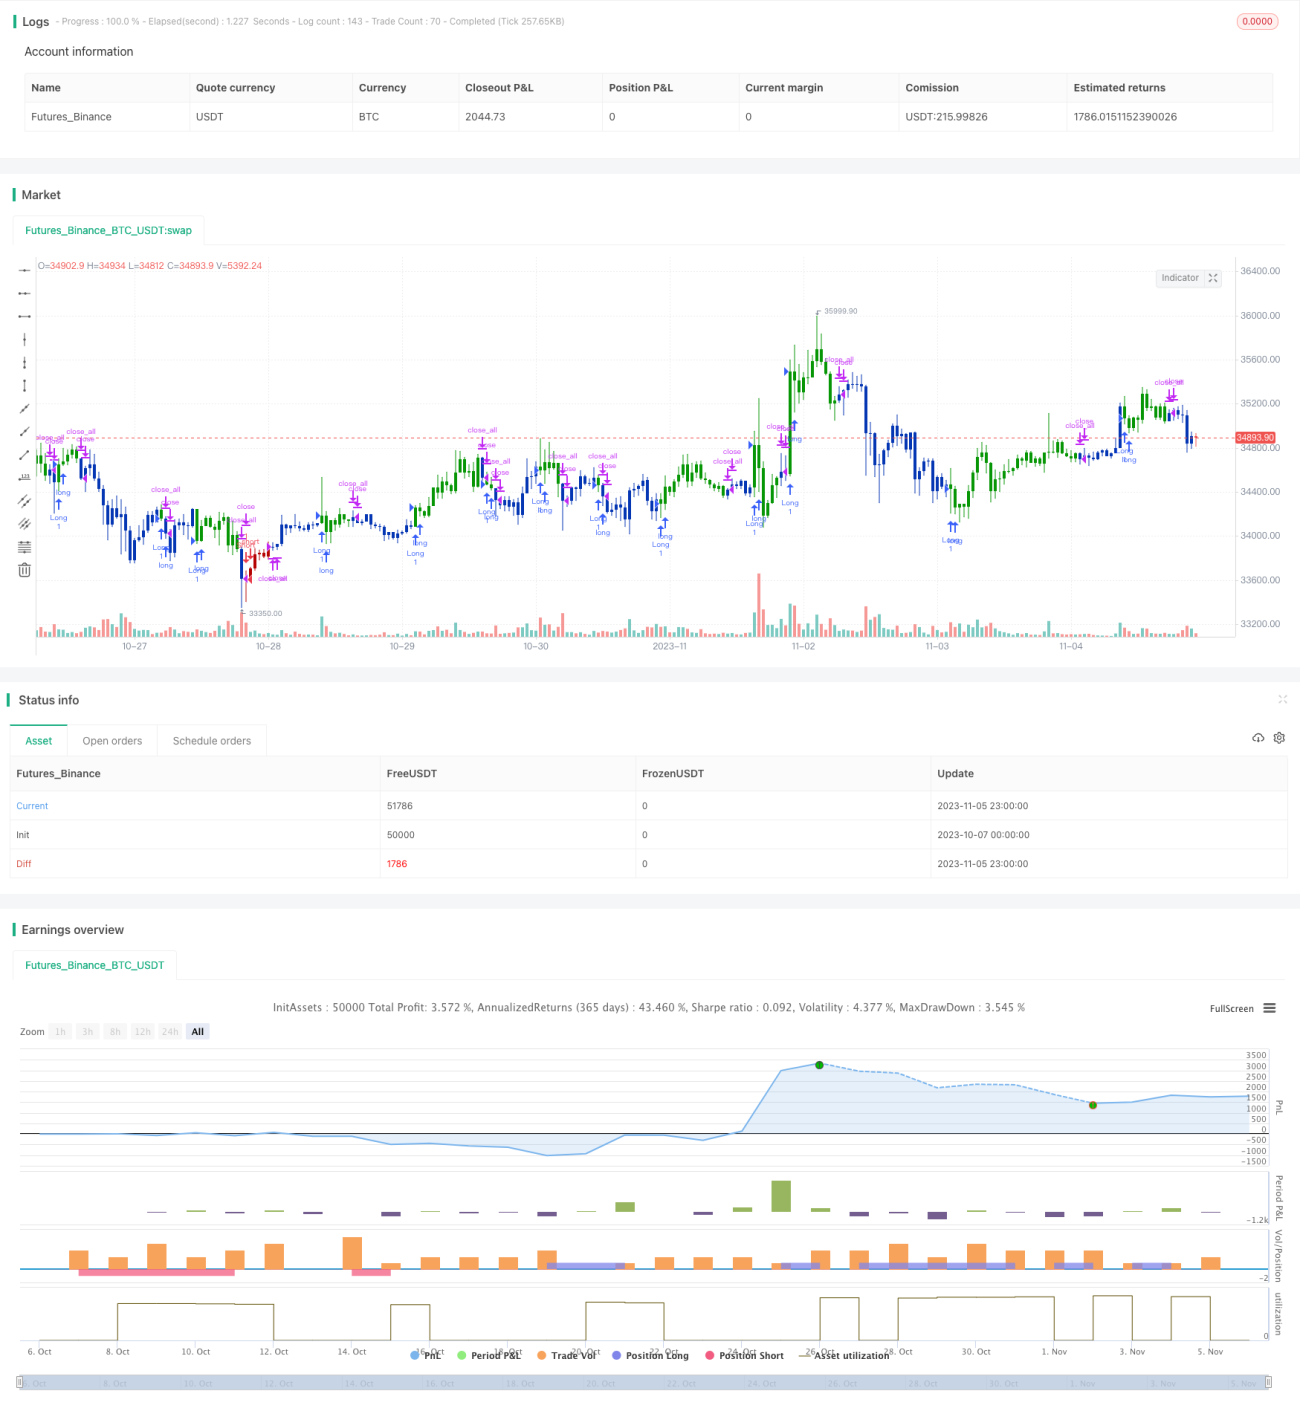
/*backtest
start: 2023-10-07 00:00:00
end: 2023-11-06 00:00:00
period: 1h
basePeriod: 15m
exchanges: [{"eid":"Futures_Binance","currency":"BTC_USDT"}]
*/
//@version=4
////////////////////////////////////////////////////////////
// Copyright by HPotter v1.0 26/11/2019
// This is combo strategies for get a cumulative signal.
//
// First strategy
// This System was created from the Book "How I Tripled My Money In The
// Futures Market" by Ulf Jensen, Page 183. This is reverse type of strategies.
// The strategy buys at market, if close price is higher than the previous close
// during 2 days and the meaning of 9-days Stochastic Slow Oscillator is lower than 50.
// The strategy sells at market, if close price is lower than the previous close price
// during 2 days and the meaning of 9-days Stochastic Fast Oscillator is higher than 50.
//
// Second strategy
// This Indicator plots a single
// Daily DSP (Detrended Synthetic Price) and a Daily ELI (Ehlers Leading
// Indicator) using intraday data.
// Detrended Synthetic Price is a function that is in phase with the dominant
// cycle of real price data. This one is computed by subtracting a 3 pole Butterworth
// filter from a 2 Pole Butterworth filter. Ehlers Leading Indicator gives an advanced
// indication of a cyclic turning point. It is computed by subtracting the simple
// moving average of the detrended synthetic price from the detrended synthetic price.
// Buy and Sell signals arise when the ELI indicator crosses over or under the detrended
// synthetic price.
// See "MESA and Trading Market Cycles" by John Ehlers pages 64 - 70.
//
// WARNING:
// - For purpose educate only
// - This script to change bars colors.
////////////////////////////////////////////////////////////
Reversal123(Length, KSmoothing, DLength, Level) =>
vFast = sma(stoch(close, high, low, Length), KSmoothing)
vSlow = sma(vFast, DLength)
pos = 0.0
pos := iff(close[2] < close[1] and close > close[1] and vFast < vSlow and vFast > Level, 1,
iff(close[2] > close[1] and close < close[1] and vFast > vSlow and vFast < Level, -1, nz(pos[1], 0)))
pos
D_ELI(Length) =>
pos = 0.0
xHL2 = security(syminfo.tickerid, 'D', hl2)
xEMA1 = ema(xHL2, Length)
xEMA2 = ema(xHL2, 2 * Length)
xEMA1_EMA2 = xEMA1 - xEMA2
xResultEMA = ema(xEMA1_EMA2, Length)
nRes = xEMA1_EMA2 - xResultEMA
pos:= iff(nRes > 0, 1,
iff(nRes < 0, -1, nz(pos[1], 0)))
pos
strategy(title="Combo Backtest 123 Reversal & D_ELI (Ehlers Leading Indicator)", shorttitle="Combo", overlay = true)
Length = input(14, minval=1)
KSmoothing = input(1, minval=1)
DLength = input(3, minval=1)
Level = input(50, minval=1)
//-------------------------
LengthELI = input(7, minval=1)
reverse = input(false, title="Trade reverse")
posReversal123 = Reversal123(Length, KSmoothing, DLength, Level)
posD_ELI = D_ELI(LengthELI)
pos = iff(posReversal123 == 1 and posD_ELI == 1 , 1,
iff(posReversal123 == -1 and posD_ELI == -1, -1, 0))
possig = iff(reverse and pos == 1, -1,
iff(reverse and pos == -1 , 1, pos))
if (possig == 1)
strategy.entry("Long", strategy.long)
if (possig == -1)
strategy.entry("Short", strategy.short)
if (possig == 0)
strategy.close_all()
barcolor(possig == -1 ? #b50404: possig == 1 ? #079605 : #0536b3 )