
概要
この戦略の目的は,トレンド株 (または他のトレンド市場) の低リスク戦略を追跡し,最小の撤回率を達成することを目指す (例えば,執筆時点では,AAPLは約1.36%の撤回率,FBは約1.93%の撤回率,SPYは0.80%の撤回率で,すべて利益を維持している).
戦略原則
この戦略は,200日移動平均線,カスタマイズされたブリン帯,52周期重圧移動平均TSIとADXの強さを利用している.
買取シグナルは:閉盤は200日移動平均より高い + 5K線閉盤は上部カスタムブリン帯より高い + TSIは正 + ADXは20より高い。
この戦略は,トレンド株のみに適用され,いくつかの売り込み/空白条件が削除され,多発注のみが採用されている.
優位分析
この戦略の利点は,引き戻し率が低く,リスクが最小であり,ほとんどのトレンド株の低リスク操作に適しており,テストデータによると,収益が高く,再評価期間にAAPLのみ1.36%の最大引き戻し,FBは1.93%の最大引き戻しである.
ブリン帯,MA平均線,TSI指数などの複数の技術指標を組み合わせて使用し,ADXでトレンドを判断する強弱を設定し,トレンドを判断する上向きで購入し,トレンド株の中長線上の<unk>のチャンスを掴むようにする.単一の指標判断と比較して,この戦略は,複数の技術指標を総合的に使用し,判断はより正確で信頼性があり,リスクは低い.
この戦略には,TSI指標の方向転換時に,利益を最大限にロックし,リスクを効果的に制御するストップ・ローズ戦略も含まれています.
リスク分析
この戦略には2つの大きなリスクがあります.
-
突発事件のリスク: ブラック・スウェン事件によって,株価が急激に下落し,損益は抑えられない.
-
トレンド終了リスク。 株がトレンドから収束に突入すると,より大きな引き下がりが起こりうる。
リスク"に対して,より厳格な止損機構を設定するか,人工介入止損を行うことができる.リスク"に対して,より多くの判断要因を組み合わせてトレンドの終結を検出することができる.例えば,取引量指標の増加などである.
最適化の方向
この戦略は,以下の点で最適化できます.
-
ストップ・ストップ・ストラテジーを追加し,より正確なストップ・ストップ・ポイントを設定し,リスクをよりよくコントロールする.
-
平均線パラメータを最適化し,異なるパラメータの組み合わせの安定性をテストする.
-
トレンドの始まりと終わりをより正確に判断するための判断システムである量能指数を増やす.
-
より長い時間周期のパラメータをテストし,より長いラインの操作に適応する.
要約する
この戦略は,ADXによってトレンドの強さを判断し,TSI指標によってトレンドの方向を判断し,ブリン帯によってブレークを判断し,移動平均によって長期のトレンドを判断し,複数の指標によって相互検証され,購入のタイミングを判断する.止損戦略は,リスクを効果的に制御することができます.この戦略は,トレンドの株を長線で追跡し,引き戻し率が低く,収益が高く,一定の優位性があります.しかし,リスクに最適化され,戦略をより安定させる必要があります.
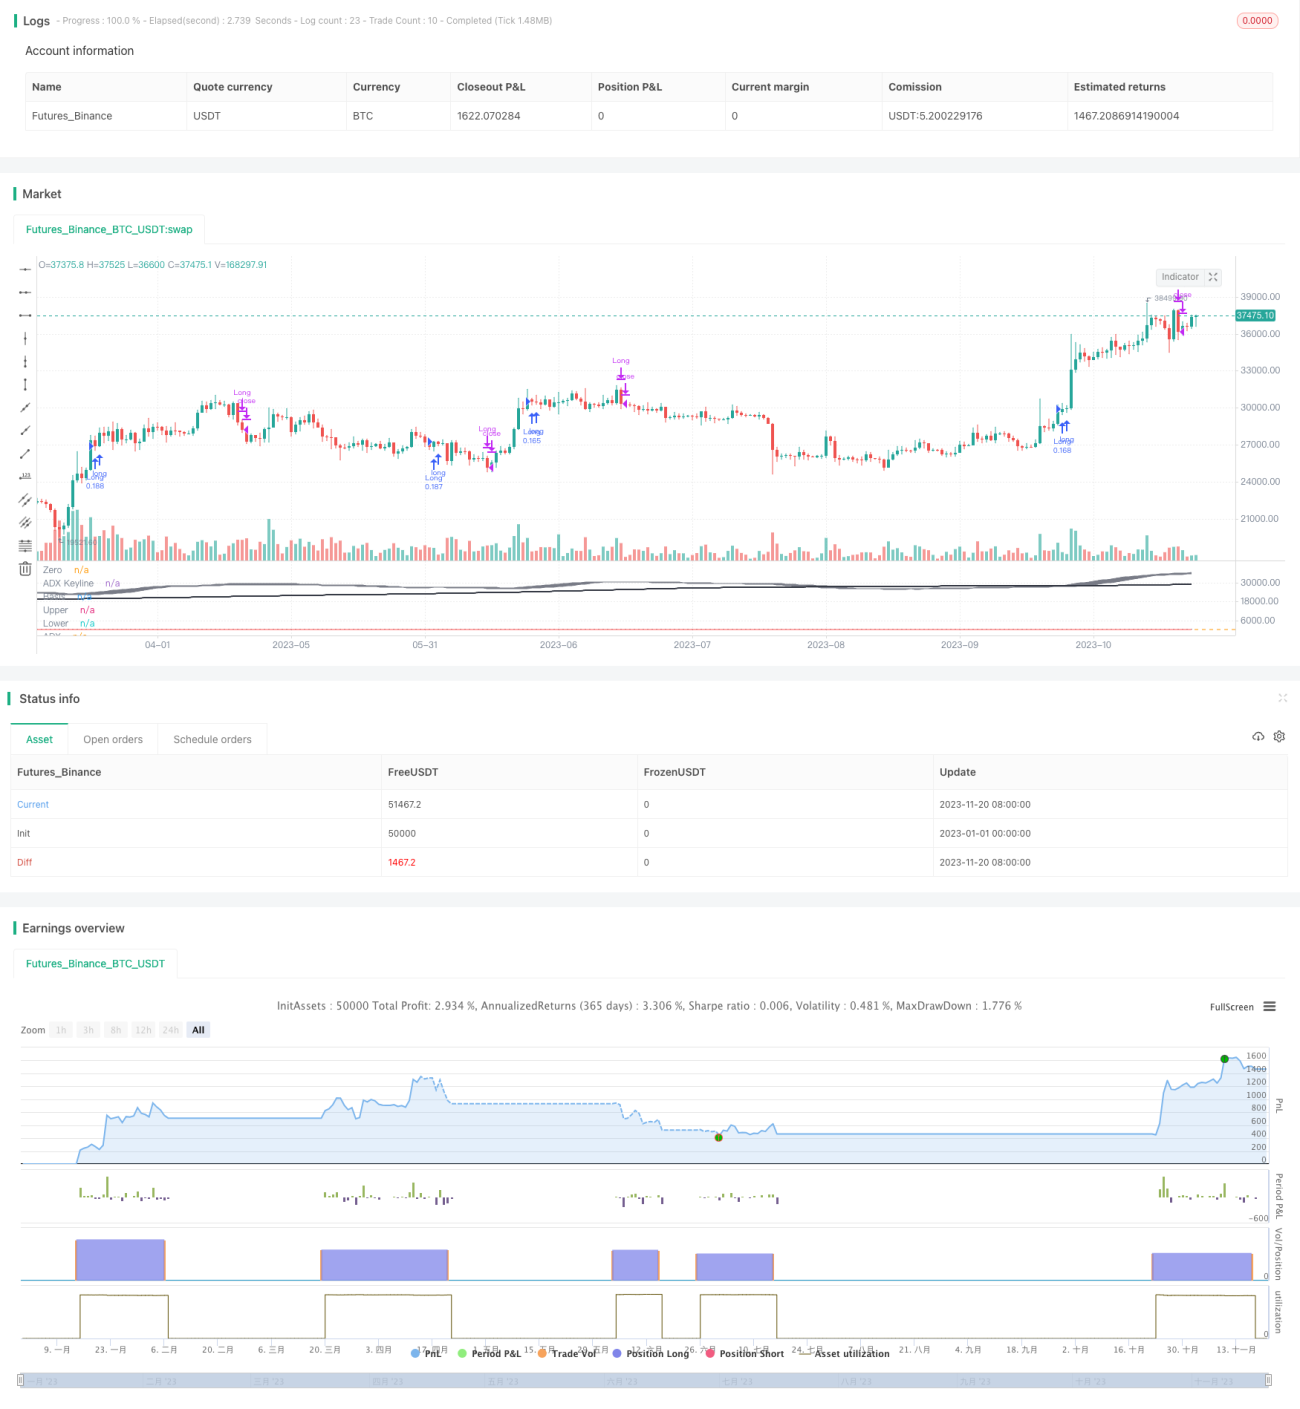
/*backtest
start: 2023-01-01 00:00:00
end: 2023-11-21 00:00:00
period: 1d
basePeriod: 1h
exchanges: [{"eid":"Futures_Binance","currency":"BTC_USDT"}]
*/

// This source code is subject to the terms of the Mozilla Public License 2.0 at https://mozilla.org/MPL/2.0/
// © gary_trades
//This script has been designed to be used on trending stocks as a low risk trade with minimal drawdown, utilising 200 Moving Average, Custom Bollinger Band, TSI with weighted moving average and ADX strength.
//Backtest dates are set to 2010 - 2020 and all other filters (moving average, ADX, TSI , Bollinger Band) are not locked so they can be user amended if desired. - 1