現代のラゲール変換RSI最適化戦略

1
Follow
1779
Followers
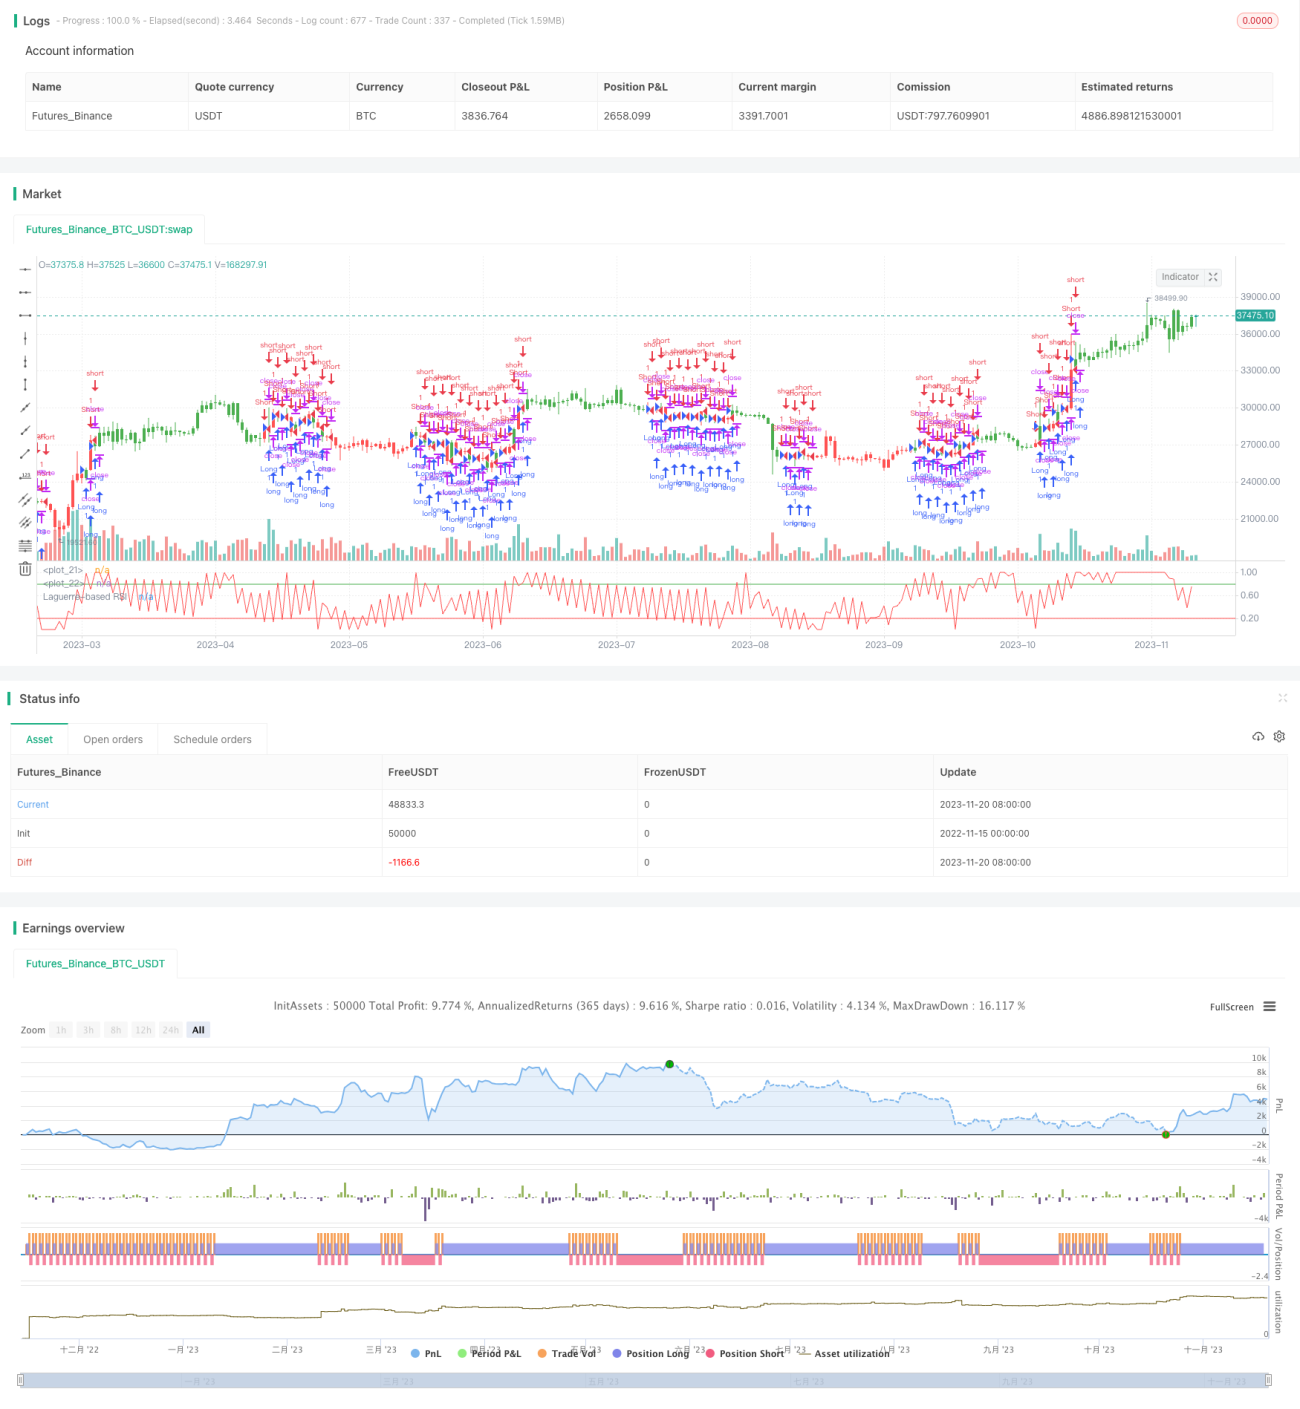
戦略の名前:
概要
この記事では,ラガエル・トランスフォーメーションに基づく相対的に強い指標 (RSI) の最適化策について詳しく見ていきます.この戦略は,RSIの感性を強化するために,ラガエル・トランスフォーメーションの<unk>を高度な数学ツールを使用して,市場価格の変化により迅速に反応します.
戦略原則
ラガエル変換RSI指標は,ラガエルフィルターを使用することで,より短いデータ長さで高効率の指標を作成できます. この戦略の核心は,ラガエル変換を使用して価格の配列を処理し,四つのレベルのラガエル線 ((xL0,xL1,xL2,xL3) を得ることです.gamma市場動向を分析するための計算を行う.
策略は,市場の強弱を判断するためにCU (累積上昇値) とCD (累積下降値) を使用する.CUとCDの計算は,ラゲル線の相対的な位置に基づいている.この方法は,RSI値が価格変化をより迅速に反映できるようにし,トレーダーに適切な取引信号を提供します.
取引シグナルは,RSI値とユーザが定義した買入と売却の境界 ((BuyBandとSellBand)) を比較して生成されます. RSI値が買入の境界を超えると,戦略は多めにすることをお勧めします.
優位分析
- **ツイッターでは,**ラゲール変数を使用すると,この戦略は,より短いデータ長さの間で市場の変化に迅速に反応することができる.
- **柔軟性:**ポリシーは,ユーザが自分のニーズに合わせて調整できます.
gamma国境の買取と売却 - 適応力がある異なる市場条件に適応し,短期的および中期的な価格変動に敏感である.
リスク分析
- **市場の変動:**高波動性のある市場では,指標は誤った信号を生成する可能性があります.
- **パラメータの選択:**誤ったパラメータ設定は,不正な取引信号を引き起こす可能性があります.
- **過剰取引:**指数の高い感受性により,頻繁に取引され,高い取引コストが発生する可能性があります.
最適化の方向
- **パラメータ最適化:**テストした結果,最も良い結果が
gamma価値と売買の限界 - 他の指標と組み合わせると誤った信号を減らすために,他の技術分析ツールと組み合わせて使用します.
- **適応力強化:**異なる市場環境に対応するためにパラメータを動的に調整する仕組みを開発する.
要約する
全体的に見ると,ラガエル変数に基づくRSI最適化戦略は,革新的な高効率の取引ツールである.その主な利点は,市場の変化とパラメータの高度なカスタマイズ性に対する迅速な反応である.しかし,どの取引戦略と同様に,特に波動性の高い市場環境では,リスクも伴う.この戦略の効果を最大化するために,トレーダーは,他の技術分析ツールと細心のパラメータ調整を組み合わせて行うべきです.全体的に,この戦略は,短期および中期市場機会を探しているトレーダーに価値のあるツールを提供します.
Source
Pine
/*backtest
start: 2022-11-15 00:00:00
end: 2023-11-21 00:00:00
period: 1d
basePeriod: 1h
exchanges: [{"eid":"Futures_Binance","currency":"BTC_USDT"}]
*/

//@version=2
////////////////////////////////////////////////////////////
//  Copyright by HPotter v1.0 01/09/2017
// This is RSI indicator which is more sesitive to price changes. Strategy parameters
Related strategies
Comment
All comments (0)
No data
- 1