標準的なフラクショナル価格ブレイクアウト戦略

1
Follow
1779
Followers
概要
標準分数価格突破戦略 (Z-Score Price Breakout Strategy) は,価格の標準分数指標を使用して,現在の価格が異常な状態にあるかどうかを判断し,取引シグナルを生成する.価格の標準分が特定の<unk>値より高くまたは低く,価格が異常な状態に入っていることを示し,このとき,多額または空白の操作を行うことができます.
戦略原則
この戦略の核心指標は,価格のスタンダードスコア (Z-Score) で,計算式は以下の通りである.
mylang
Z_score = (C - SMA(n)) / StdDev(C,n)
Cは,閉店価格,SMA (n) は,n周期の単純移動平均線,StdDev (C,n) は,n周期の閉店価格の標準差である.
標準分は,現在の価格と平均価格の偏差の程度を反映する.価格標準分が,ある正の<unk>値 (例えば+2) よりも大きいときは,現在の価格が平均価格から2標準差が高く,比較的高いレベルにあることを示し,ある負の<unk>値 (例えば-2) よりも小さいときは,現在の価格が平均価格から2標準差が低く,比較的低いレベルにあることを示している.
この戦略は,まず価格の標準分を計算し,その後,正負の<unk>値 (例えば0と0) を設定し,標準分が正の<unk>値より高いときは買入シグナルを発生させ,負の<unk>値より低い場合は売り出します.
優位分析
- 価格基準のスコアを用いて価格異常を判断する,一般的な効果的な量化方法
- 利回りと空調の両方での取引が容易に可能
- パラメータ設定の柔軟性,周期,<unk>値など調整可能
- 他の指標と組み合わせて取引システムを作ることができる
リスク分析
- スタンダードスコア戦略は粗放で,偽信号を生成しやすい.
- 周期や<unk>値などの適切なパラメータを設定する必要があります
- リスクのコントロールを考える
最適化の方向
- 周期を最適化して,最適な周期を探します.
- ポジティブ・ネガティブ・<unk>値の最適化と偽信号の低減
- フィルタリング条件を追加し,他の指標と組み合わせる
- ストップ・ロスの策略を増やす
要約する
標準分数価格突破戦略は,現在の価格が異常な状態にあるかどうかを判断し,価格標準分数の正負に基づいて取引する.この戦略は簡単で,両方向に取引できるが,一定のリスクもある.パラメータ最適化やストップ・ロスのような手段によって,この戦略を強化し,他の指標の組み合わせと完全な量化取引システムを形成することができる.
Source
Pine
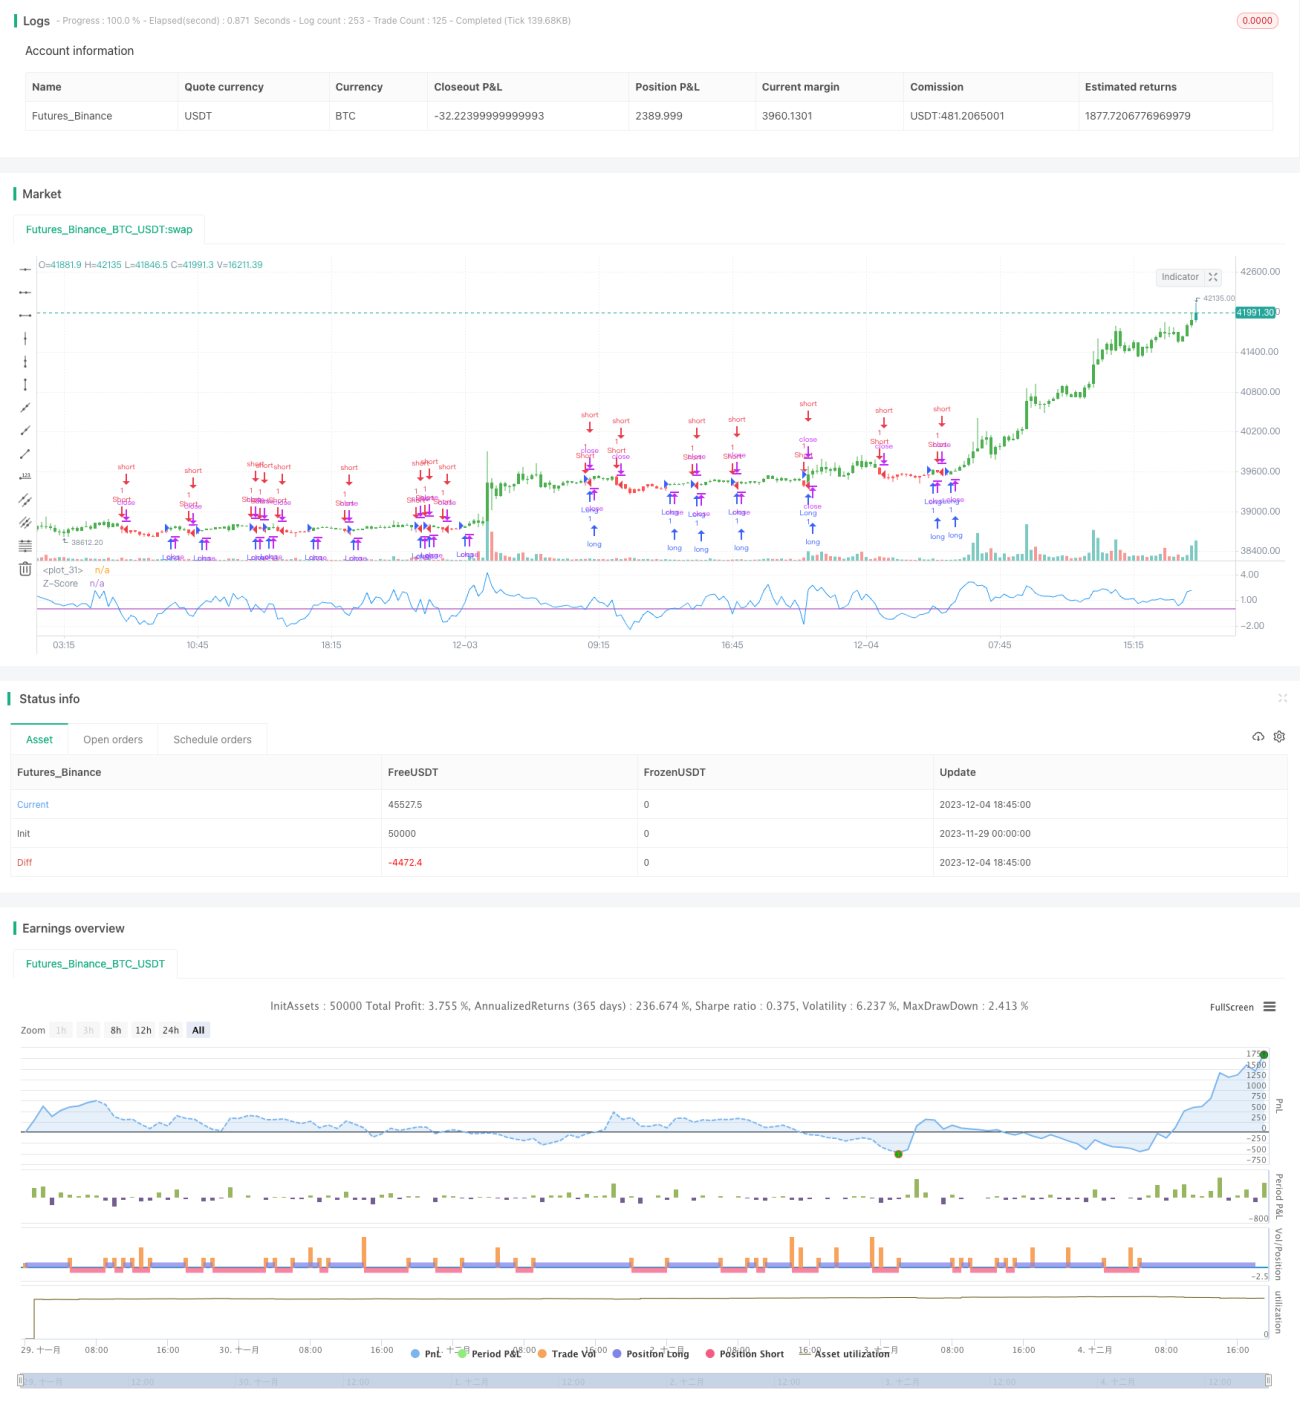
/*backtest
start: 2023-11-29 00:00:00
end: 2023-12-04 19:00:00
period: 15m
basePeriod: 5m
exchanges: [{"eid":"Futures_Binance","currency":"BTC_USDT"}]
*/

//@version=2
////////////////////////////////////////////////////////////
//  Copyright by HPotter v1.0 18/01/2017
// The author of this indicator is Veronique Valcu. The z-score (z) for a data Strategy parameters
Related strategies
Comment
All comments (0)
No data
- 1