複数の指標に基づいたジョンのビットコイン・イントラデイ・トレーディング戦略

作者: リン・ハーンチャオチャン, 日付: 2023-12-07 15:23:44
タグ:

img

概要

この戦略は,RSI,MFI,Stock RSIおよびMACD4つの指標を組み合わせてビットコイン内日取引を実装する.複数の指標が同時にリスク制御のために購入または販売信号を与える場合にのみ注文が行われます.

戦略の論理

  1. RSIインジケーターは,市場がオーバーバイドまたはオーバーセールされているかどうかを判断するために使用されます.RSIが40を下回ると購入信号,RSIが70を超えると販売信号を生成します.

  2. MFI指標は,市場における資本流動を判断します.MFIが23未満の場合は購入信号,MFIが80を超えると販売信号を生成します.

  3. ストックRSIインジケーターは,市場が過買いまたは過売れているかどうかを決定します.K線が34を下回ると購入信号,80を超えると販売信号を生成します.

  4. MACD指標は市場の動向と勢いを判断する.高速線がスローラインを下回り,ヒストグラムがマイナスで,逆シナリオで売り信号を生成する.

利点分析

  1. 4つの主要指標を組み合わせることで,信号の精度が向上し,単一の指標の故障による損失を回避できます.

  2. 注文は複数のインジケーターが同時にシグナルを出す場合にのみ行われ,誤ったシグナルの確率が大幅に減少します.

  3. 日中の取引戦略を採用することで,一日のリスクが回避され,資本コストが削減されます.

リスク と 解決策

  1. 戦略の取引頻度は比較的低く,一定の時間上のリスクが伴います.取引の数を増やすために指標パラメータを適切に緩和することができます.

  2. インディケーターが誤った信号を与える可能性は依然としてある.インディケーター信号の信頼性を判断するのに役立つ機械学習アルゴリズムが導入できる.

  3. 過剰購入および過剰売却リスクもあります.指標パラメータをそれに応じて調整したり,より多くの指標ロジックを追加したりできます.

オプティマイゼーションの方向性

  1. アダプティブ指標パラメータ機能を追加します. 市場の変動と変化速度に基づいて,リアルタイムで指標パラメータを調整します.

  2. ストップ損失ロジックを追加します. 損失が一定パーセントを超えると単一の損失を効果的に制御します.

  3. 市場熱や市場恐怖などの多次元的な判断を増やして戦略の利益空間を向上させる.

結論

この戦略は,4つの主要な指標を通じてシグナルを検証することで,誤ったシグナル率を効果的に低下させ,比較的安定した高周波利益戦略である.パラメータとモデルの継続的な最適化により,戦略の勝利率と収益性はさらに向上することができる.


/*backtest
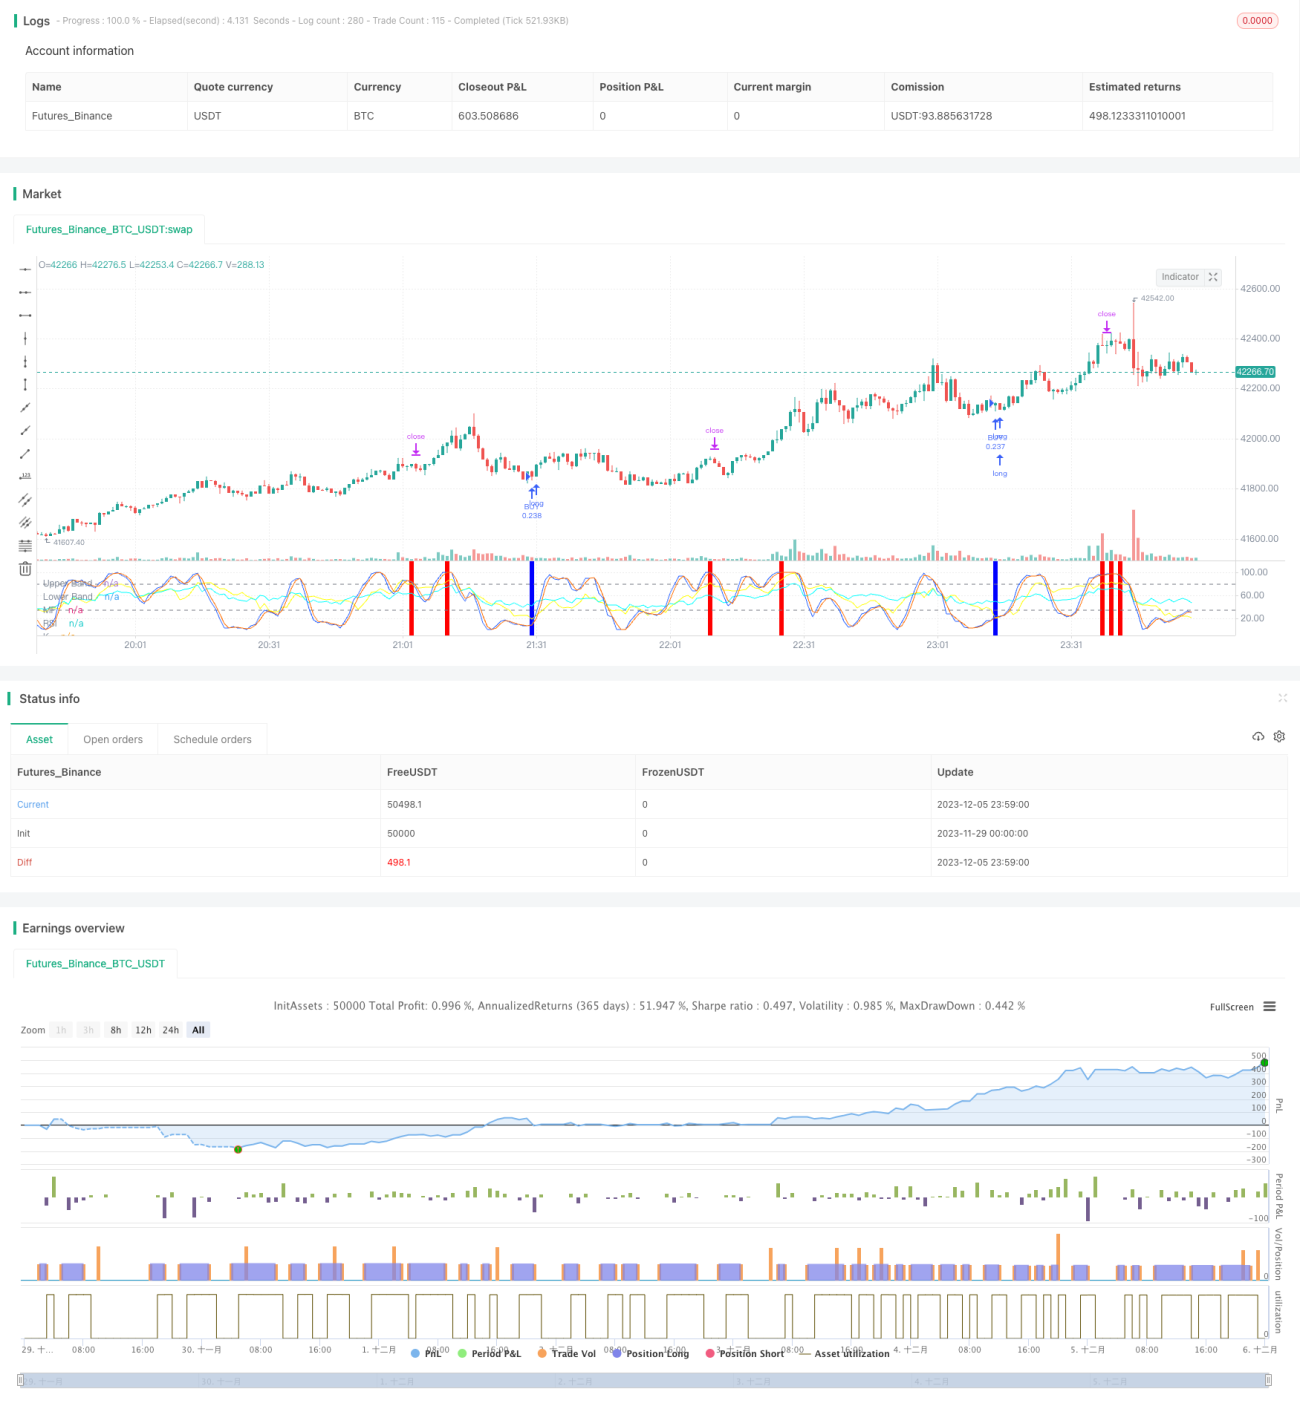
start: 2023-11-29 00:00:00
end: 2023-12-06 00:00:00
period: 1m
basePeriod: 1m
exchanges: [{"eid":"Futures_Binance","currency":"BTC_USDT"}]
*/


//@version=5
strategy('John Day Stop Loss', overlay=false, pyramiding=1, default_qty_type=strategy.cash, default_qty_value=10000, initial_capital=10000, currency='USD', precision=2)
strategy.risk.allow_entry_in(strategy.direction.long) 

from_day = input.int(defval=1, title='From Day', minval=1)
from_month = input.int(defval=1, title='From Month', minval=1)
from_year = input.int(defval=2021, title='From Year', minval=2020)
to_day = input.int(defval=1, title='To Day', minval=1)
to_month = input.int(defval=1, title='To Month', minval=1)
to_year = input.int(defval=2025, title='To Year', minval=2020)

time_cond = time > timestamp(from_year, from_month, from_day, 00, 00) and time < timestamp(to_year, to_month, to_day, 00, 00)
//time_cond = true

//Stop Loss
longProfitPerc = input.float(title="Stop Loss Profit (%)", defval=2.1) / 100
longExitPrice  = strategy.position_avg_price * (1 - longProfitPerc)

//RSI - yellow
up = ta.rma(math.max(ta.change(close), 0), 14)
down = ta.rma(-math.min(ta.change(close), 0), 14)
rsi = down == 0 ? 100 : up == 0 ? 0 : 100 - (100 / (1 + up / down))
plot(rsi, "RSI", color=#00FFFF)
buy_rsi = true // rsi < 40
sell_rsi = true //rsi > 70

//MFI - cyan
mf = ta.mfi(hlc3, 14)
plot(mf, "MF", color=#FFFF00)
buy_mfi = mf < input.int(defval=23, title='Max MF', minval=1)
sell_mfi = mf > input.int(defval=80, title='Min MF', minval=1)

//Stoch RSI
OverBought_StochRSI = input(80)
OverSold_StochRSI = input(34)
smoothK = input.int(3, "K", minval=1)
smoothD = input.int(2, "D", minval=1)
lengthRSI = input.int(14, "RSI Length", minval=1)
lengthStoch = input.int(14, "Stochastic Length", minval=1)
srcRSI = input(close, title="RSI Source")
rsi1 = ta.rsi(srcRSI, lengthRSI)
kStochRSI = ta.sma(ta.stoch(rsi1, rsi1, rsi1, lengthStoch), smoothK)
d = ta.sma(kStochRSI, smoothD)
co = ta.crossover(kStochRSI,d)
cu = ta.crossunder(kStochRSI,d)

buy_stochRSI = co and kStochRSI < OverSold_StochRSI
sell_stochRSI = cu and kStochRSI > OverBought_StochRSI

plot(kStochRSI, "K", color=#2962FF)
plot(d, "D", color=#FF6D00)
h0 = hline(OverBought_StochRSI, "Upper Band", color=#787B86)
h1 = hline(OverSold_StochRSI, "Lower Band", color=#787B86)
fill(h0, h1, color=color.rgb(33, 150, 243, 90), title="Background")

//MACD
// Getting inputs
fast_length = input(title="Fast Length", defval=12)
slow_length = input(title="Slow Length", defval=26)
src = input(title="Source", defval=close)
signal_length = input.int(title="Signal Smoothing",  minval = 1, maxval = 50, defval = 9)
sma_source = input.string(title="Oscillator MA Type",  defval="EMA", options=["SMA", "EMA"])
sma_signal = input.string(title="Signal Line MA Type", defval="EMA", options=["SMA", "EMA"])
// Plot colors
//col_macd = input(#2962FF, "MACD Line  ", group="Color Settings", inline="MACD")
//col_signal = input(#FF6D00, "Signal Line  ", group="Color Settings", inline="Signal")
//col_grow_above = input(#26A69A, "Above   Grow", group="Histogram", inline="Above")
//col_fall_above = input(#B2DFDB, "Fall", group="Histogram", inline="Above")
//col_grow_below = input(#FFCDD2, "Below Grow", group="Histogram", inline="Below")
//col_fall_below = input(#FF5252, "Fall", group="Histogram", inline="Below")
// Calculating
fast_ma = sma_source == "SMA" ? ta.sma(src, fast_length) : ta.ema(src, fast_length)
slow_ma = sma_source == "SMA" ? ta.sma(src, slow_length) : ta.ema(src, slow_length)
macd = fast_ma - slow_ma
signal = sma_signal == "SMA" ? ta.sma(macd, signal_length) : ta.ema(macd, signal_length)
hist = macd - signal
buy_MACD = macd < signal and hist < 0 
sell_MACD = macd > signal and hist > 0 

//buy_MACD = true 
//sell_MACD = true

//plot(hist, title="Histogram", style=plot.style_columns, color=(hist>=0 ? (hist[1] < hist ? col_grow_above : col_fall_above) : (hist[1] < hist ? col_grow_below : col_fall_below)))
//plot(macd, title="MACD", color=col_macd)
//plot(signal, title="Signal", color=col_signal)

sessionColor = color(na)
if time_cond

    if (not na(kStochRSI) and not na(d))
        cmt = str.tostring(close)
    	if (buy_stochRSI and buy_MACD and buy_mfi and buy_rsi)
    		strategy.entry("BUY", strategy.long, comment='BUY @ ' + cmt)
    		if longProfitPerc != 0
    		    strategy.exit(id="x", stop=longExitPrice, comment='EXIT @ ' + str.tostring(longExitPrice))
        	sessionColor := input.color(#0000FF, "buy") //red
    	if (sell_stochRSI and sell_MACD and sell_mfi and sell_rsi)
    		strategy.entry("SELL", strategy.short, comment='SELL @ ' + cmt)
    		sessionColor := input.color(#FF0000, "sell") //green
    	
bgcolor(sessionColor)

もっと