乱数に基づく定量取引戦略
概要
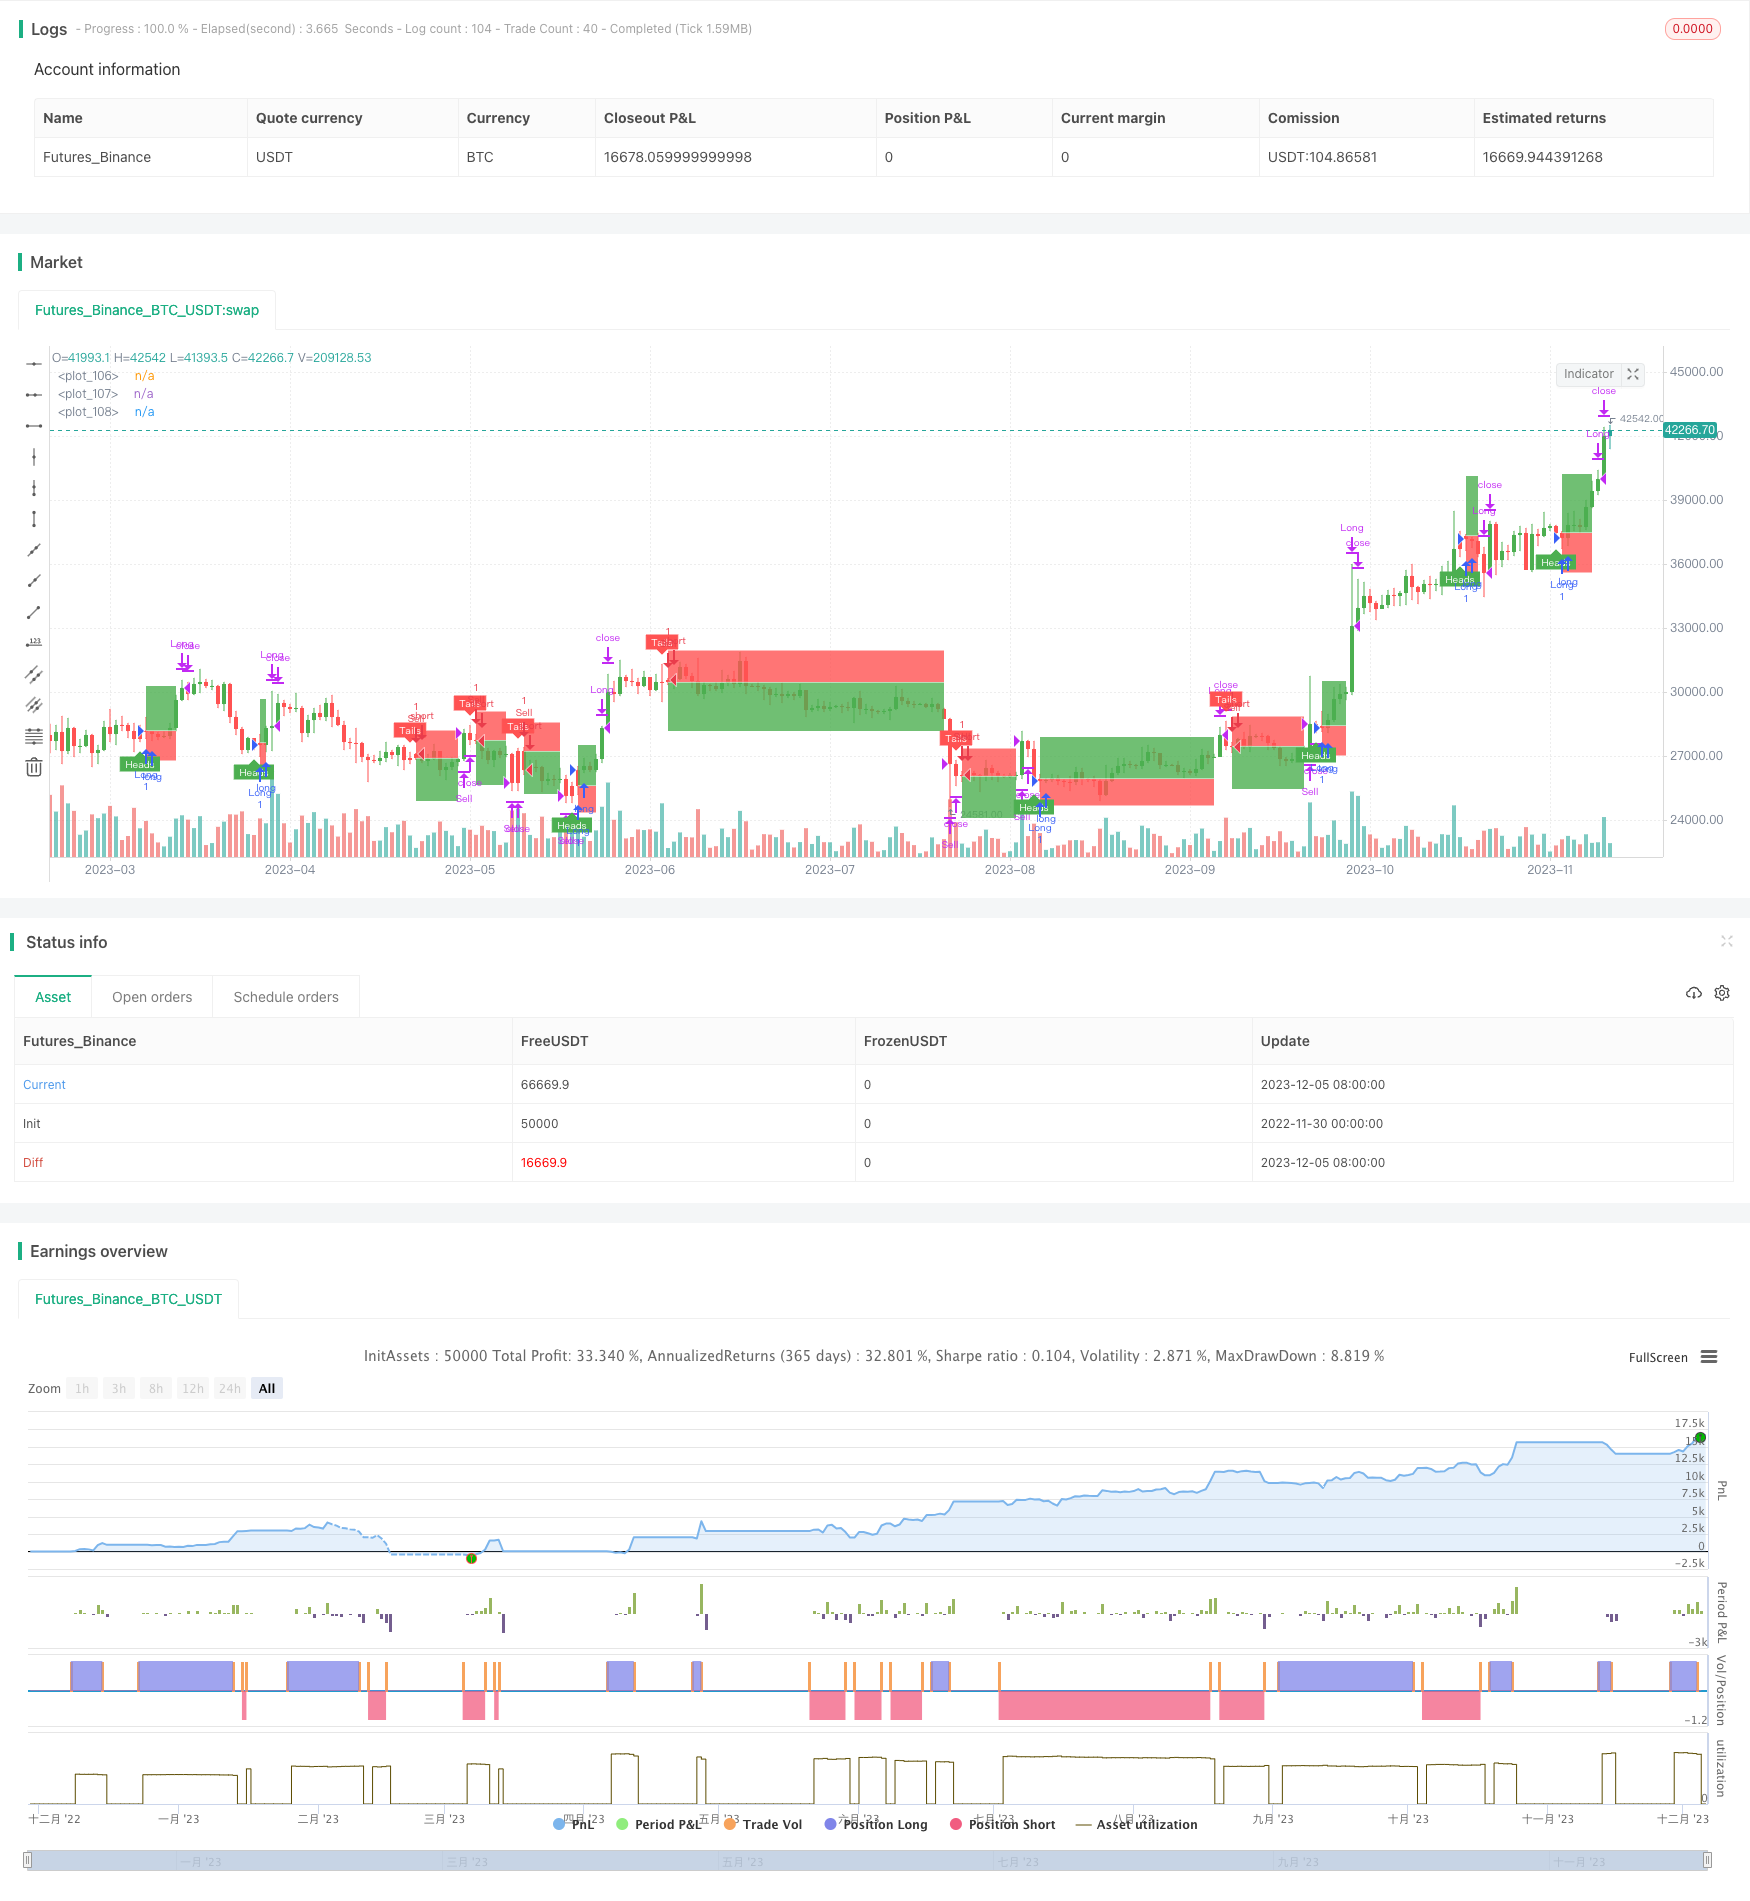
この戦略の核心的な考えは,ランダムな数を使ってコインの色子などの確率的な出来事を模擬し,事件の結果に応じて多頭または空頭を決定し,それによってランダムな取引を実現することである.この取引戦略は,模擬テストに使用することも,より複雑な戦略開発のための基礎フレームワークとして使用することもできる.
戦略原則
合格
flip変数はランダムなイベントを模擬する.coinLabelランダムな数値で 余分な時間や空き時間を決めます活用する
riskそしてratio止損防止線を設定する.設定された最大周期数に従って,次の取引シグナルをランダムにトリガーします.
合格
plotBox変数制御で平仓箱が表示されるかどうかstoppedOutそしてtakeProfit変数は止損または停止を検出するために使用される.機能テスト戦略のパフォーマンスに関するフィードバックを提供する.
優位分析
コード構造は明確で,理解し,二次開発が容易です.
UIはインタラクティブで,様々なパラメータをグラフィック・インターフェースで調整できます.
ランダム性があり,市場の波動に影響を受けず,信頼性が高い.
パラメータの最適化により,よりよい収益率を得ることができます.
他の戦略のデモンストレーションやテストとして使用できます.
リスク分析
ランダムな取引は市場を判断できず,一定の利益のリスクがある.
最適なパラメータの組み合わせは決定できないので,繰り返しテストが必要である.
ランダムな信号があまりにも密集しているため,超関連リスクが生じる可能性があります.
リスク管理のために,止損防止メカニズムを組み合わせることをお勧めします.
取引間隔を適切に延長することでリスクを減らすことができます.
最適化の方向
より複雑な要素と組み合わせたランダムな信号が生まれます.
取引品種を増やし,テスト範囲を広げます.
UIのインタラクションを最適化し,ポリシー制御機能を追加した.
テストツールや指標を多く提供し,パラメータの最適化に役立てます.
取引シグナルまたはストップ・ストップコンポーネントとして他の戦略に追加できます.
要約する
この戦略の全体的な枠組みは完ぺきで,ランダムなイベントに基づいて取引信号を生成し,高い信頼性がある.また,パラメータの調整,反測,およびマッピング機能を提供している.これは,初心者の開発戦略をテストするために使用することも,他の戦略の基礎モジュールとして使用することもできる.適切な最適化により,戦略のパフォーマンスをより顕著にすることができる.
/*backtest
start: 2022-11-30 00:00:00
end: 2023-12-06 00:00:00
period: 1d
basePeriod: 1h
exchanges: [{"eid":"Futures_Binance","currency":"BTC_USDT"}]
*/

// This source code is subject to the terms of the Mozilla Public License 2.0 at https://mozilla.org/MPL/2.0/
// © melodicfish

//@version=4
strategy("Coin Flipper Pro",overlay=true,max_bars_back=100)

// ======= User Inputs variables=========

h1=input(title="------- Trade Activity -------",defval=false)
maxBars=input(25.0,title="Max Bars between Coin Filps",step=1.0,minval=4.0)

h2=input(title="------- Position Settings -------",defval=false)
risk=input(defval=5.0,title="Risk in % ",type=input.float, minval=0.001 ,step=0.1)
ratio= input(defval=1.5,title="Risk to Reward Ratio x:1 ",type=input.float, minval=0.001,step=0.1)

h3=input(title="------- Plot Options -------",defval=false)
showBox=input(defval=true, title="Show Position Boxes")

h4=input(title="------- Back Testing -------",defval=false)
runTest=input(defval=true, title="Run Strategy Back Test")
customTime=input(defval=false, title="Use Custom Date Range for back test")


tsYear = input(2021,minval=1000,maxval=9999,title= "Test Start Year")
tsMonth = input(1,minval=1,maxval=12,title= "Test Start Month")
tsDay = input(1,minval=1,maxval=31,title= "Test Start Day")
start = timestamp(tsYear,tsMonth,tsDay,0,0)

teYear = input(2021,minval=1000,maxval=9999,title=  "Test Stop Year")
teMonth = input(5,minval=1,maxval=12,title=  "Test Stop Month")
teDay = input(1,minval=1,maxval=31,title=  "Test Stop Day")
end = timestamp(teYear,teMonth,teDay,0,0)

// ======= variables =========
var barsBetweenflips=25
var coinFlipResult=0.0
var flip=true
var coinLabel=0.0
var stoppedOut= true
var takeProfit=true
var posLive=false
var p1=0.0
var p2=0.0
var p3=0.0
var plotBox=false
var posType=0
long=false
short=false


// ===== Functions ======

getColor() =>
    round(random(1,255))


// ===== Logic ========
if barssince(flip==true)>barsBetweenflips and posLive==false
    flip:=true
    coinLabel:=random(1,10)

    // Candle Colors
candleColor= flip==true and flip[1]==false and barstate.isconfirmed==false?color.rgb(getColor(),getColor(),getColor(),0):flip==false and close>=open?color.green:color.red
candleColor:= barstate.ishistory==true and close>=open?color.green: barstate.ishistory==true and close<open? color.red:candleColor
barcolor(candleColor)

if flip[1]==true and posLive==false
    flip:=false
    barsBetweenflips:=round(random(3,round(maxBars)))
    posLive:=true

long:= flip[1]==true and coinLabel[1]>=5.0
short:= flip[1]==true and coinLabel[1]<5.0


    // Calculate Position Boxes
if long==true and posType!=1

    riskLDEC=1-(risk/100)
    p1:= close[1]*(1+((risk/100)*ratio)) // TargetLine
    p2:=close[1]
    p3:= close[1]*riskLDEC // StopLine
    plotBox:=true
    posType:=1

if short==true and posType!=-1

    riskSDEC=1-((risk*ratio)/100)
    p1:= close[1]*riskSDEC   // TargetLine
    p2:=close[1]
    p3:= close[1]*(1+(risk/100)) // StopLine
    plotBox:=true
    posType:=-1


    // Check Trade Status
stoppedOut:= posType==1 and long==false and low<= p3? true: posType==-1 and short==false and high>=p3? true: false
takeProfit:= posType==1 and long == false and high>= p1? true: posType==-1 and short==false and low<=p1? true: false
if stoppedOut==true or takeProfit==true
    posType:=0
    plotBox:=false
    posLive:=false


// ====== Plots ========
plot1=plot(plotBox and showBox? p1:na,style=plot.style_linebr,color=color.white, transp= 100)
plot2=plot(plotBox and showBox? p2:na,style=plot.style_linebr,color=color.white, transp= 100)
plot3=plot(plotBox and showBox? p3:na,style=plot.style_linebr,color=color.white, transp= 100)
fill(plot1,plot2,color= color.green)
fill(plot2,plot3,color= color.red)
plotshape(flip==true and flip[1]==false and coinLabel>=5.0,style=shape.labelup,location=location.belowbar, color=color.green,size=size.tiny,title="short label",text="Heads",textcolor=color.white)
plotshape(flip==true and flip[1]==false and coinLabel<5.0,style=shape.labeldown,location=location.abovebar, color=color.red,size=size.tiny,title="short label",text="Tails",textcolor=color.white)
if stoppedOut==true
    label.new(bar_index-1, p3, style=label.style_xcross, color=color.orange)
if takeProfit==true
    label.new(bar_index-1, p1, style=label.style_flag, color=color.blue)


if runTest==true and customTime==false or runTest==true and customTime==true and time >= start and time <= end
    strategy.entry("Sell", strategy.short,when=short==true)
    strategy.close("Sell", comment="Close Short", when=stoppedOut==true or takeProfit==true)
    strategy.entry("Long", strategy.long,when=long==true)
    strategy.close("Long",comment="Close Long", when= stoppedOut==true or takeProfit==true )