ダブル移動平均クロスオーバー戦略


作成日: 2023-12-13 15:51:13 最終変更日: 2023-12-13 15:51:13
コピー: 0 クリック数: 1316
1
フォロー
1621
フォロワー

ダブル移動平均クロスオーバー戦略

概要

双均線交差点戦略は,移動平均に基づいて定量取引戦略である.それは,快線と慢線の交差を計算して価格トレンドを判断し,交差点で買入と売却の信号を発信する.この戦略は,ハル均線を快線として,スーパースモーターフィルターを慢線として使用する.この組み合わせは,均線の平滑性とトレンド判断能力を組み合わせて,価格動きを効果的に識別し,より信頼できる取引信号を生成する.

戦略原則

双均線交差点位戦略の計算式は次のとおりである. 快線 ((ハル平均線):WMA ((2 * WMA ((値,n/2) -WMA ((値,n),SQRT ((n))
スローライン ((Super Smoother): 価値の3倍フィルター

このうち,WMAは加重移動平均を表し,SQRTは開平方根を表し,フィルタは1段階の滞り項と2段階の滞り項を含む.

戦略は,快線と遅線値を計算して,両線間の交差関係を判断する.
スローラインを突破して 買取信号を出す スローラインを突破すると 信号が売れる

優位分析

双均線交差点位戦略は,双均線判断と点位取引の優位性を組み合わせて,トレンドの転換点を正確に捉え,出場を間に合わせることができる.単一の均線戦略と比較して,以下の利点があります.

  1. 双均線組合せは偽信号を排除する.快線はトレンドの方向と強さを判断し,慢線は振動をフィルターし,信号をより信頼性のあるものにする.
  2. Super Smootherフィルタは,価格の動向を効果的に抽出できる強力なデータフィッティング能力を持っています.
  3. ハル平均線は価格変化に敏感で,時折を捕捉する.

リスク分析

双均線交差点戦略にはリスクもあります.

  1. 震動状況では,より多くのwhipsaw信号が発生することがあります. 適切な平均線間隔を広げて偽信号を減らすことができます.
  2. 双均線間隔を広げすぎると,いくつかの機会を逃してしまう. 信号の量と質をバランスさせなければならない.
  3. この戦略は,傾向がより明確な品種に適しており,高波動性製品には適用しない.

最適化の方向

双均線交差点位戦略は,以下の次元から最適化できる.

  1. 平均線パラメータを調整して,異なる周期と波動幅の品種に合わせる.
  2. whipsaw を減らすために,トレンドの質を判断する追加指標またはフィルターを追加します.
  3. トレンド指数と合わさって,ポジション構築率を最適化する.

要約する

双均線交差点戦略は,均線戦略の優位性を継承し,双均線判断と点取引方法を拡張して,より先進的な信頼性の高い定量取引方案を形成する.それは,タイミング取引に関して,実験検証と応用探索に値する独特の優位性を持っています.この記事は,戦略の原理,長所と短所を深く分析し,最適化構想を参考に提供しています.モデルとパラメータの継続的な改善とともに,この戦略は,強力なタイミングツールになると確信しています.
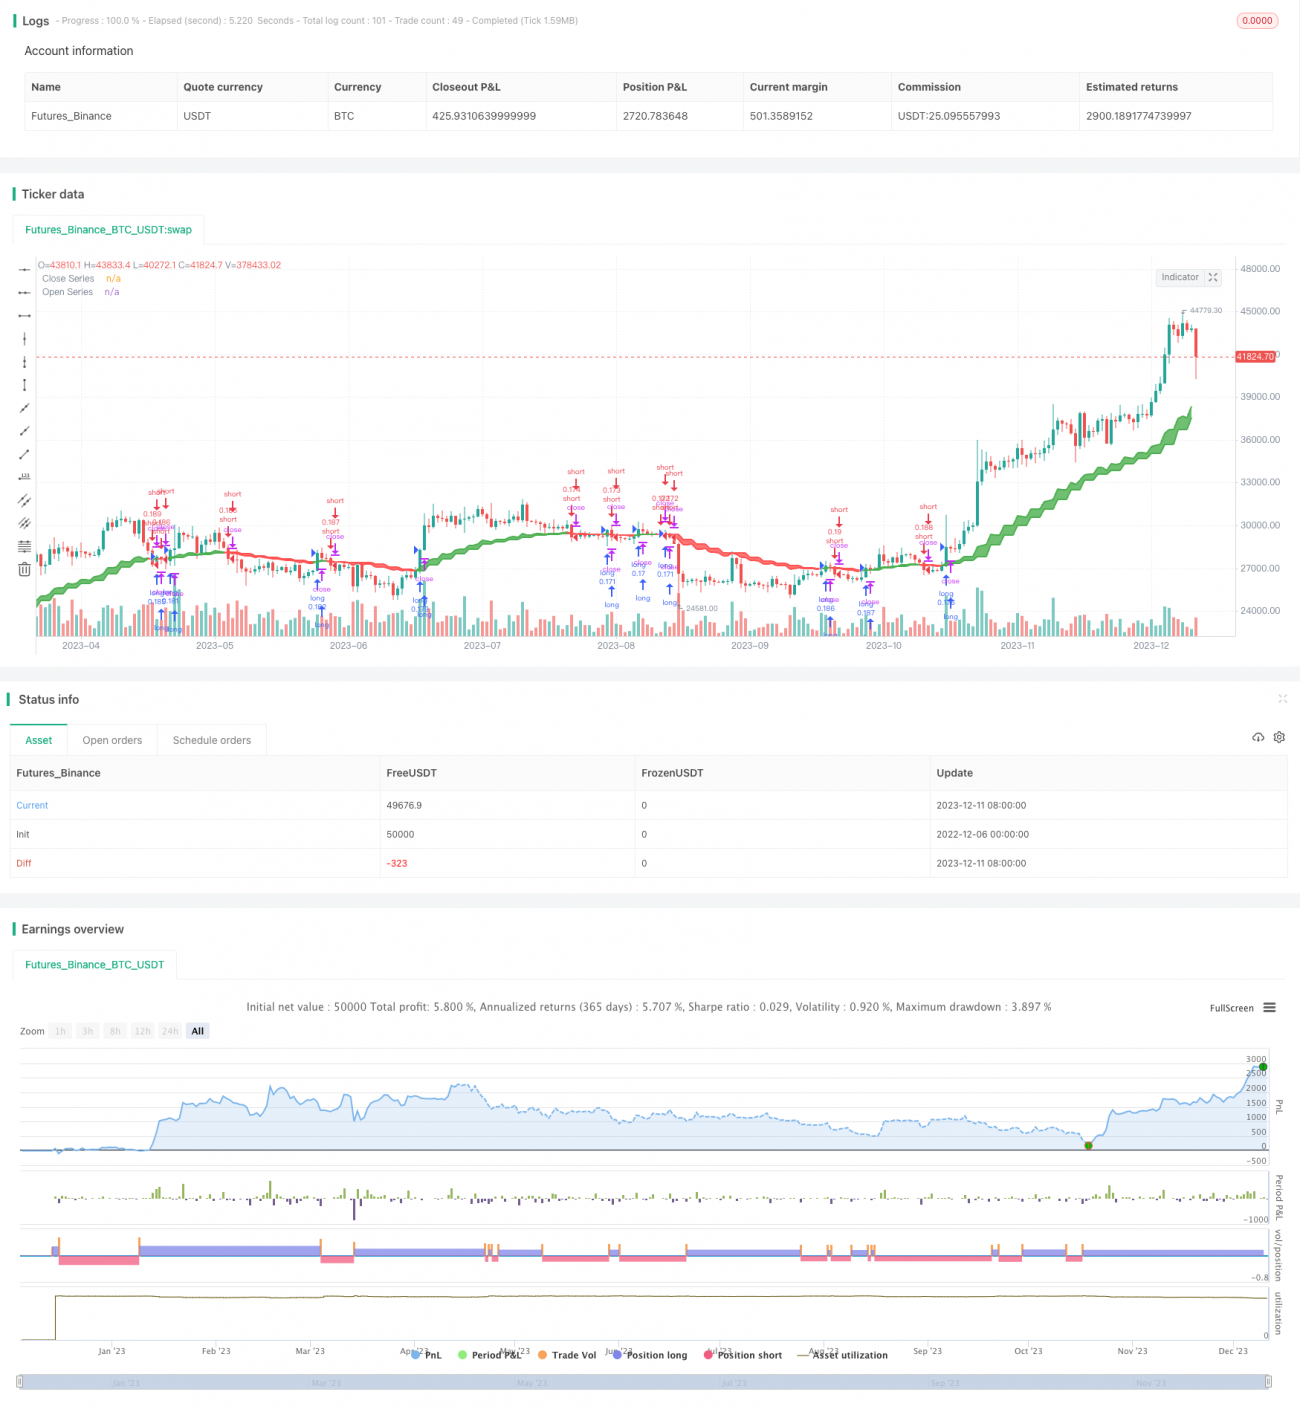
ストラテジーソースコード
/*backtest
start: 2022-12-06 00:00:00
end: 2023-12-12 00:00:00
period: 1d
basePeriod: 1h
exchanges: [{"eid":"Futures_Binance","currency":"BTC_USDT"}]
*/

//@version=5
//

strategy(title='Open Close Cross Strategy ', shorttitle='sacinvesting', overlay=true, pyramiding=0, default_qty_type=strategy.percent_of_equity, default_qty_value=10, calc_on_every_tick=false)

// === INPUTS ===
useRes = input(defval=true, title='Use Alternate Resolution?')
intRes = input(defval=3, title='Multiplier for Alernate Resolution')
stratRes = timeframe.ismonthly ? str.tostring(timeframe.multiplier * intRes, '###M') : timeframe.isweekly ? str.tostring(timeframe.multiplier * intRes, '###W') : timeframe.isdaily ? str.tostring(timeframe.multiplier * intRes, '###D') : timeframe.isintraday ? str.tostring(timeframe.multiplier * intRes, '####') : '60'
basisType = input.string(defval='SMMA', title='MA Type: ', options=['SMA', 'EMA', 'DEMA', 'TEMA', 'WMA', 'VWMA', 'SMMA', 'HullMA', 'LSMA', 'ALMA', 'SSMA', 'TMA'])
basisLen = input.int(defval=8, title='MA Period', minval=1)
offsetSigma = input.int(defval=6, title='Offset for LSMA / Sigma for ALMA', minval=0)
offsetALMA = input.float(defval=0.85, title='Offset for ALMA', minval=0, step=0.01)
scolor = input(false, title='Show coloured Bars to indicate Trend?')
delayOffset = input.int(defval=0, title='Delay Open/Close MA (Forces Non-Repainting)', minval=0, step=1)
tradeType = input.string('BOTH', title='What trades should be taken : ', options=['LONG', 'SHORT', 'BOTH', 'NONE'])
// === /INPUTS ===

// Constants colours that include fully non-transparent option.
green100 = #008000FF
lime100 = #00FF00FF
red100 = #FF0000FF
blue100 = #0000FFFF
aqua100 = #00FFFFFF
darkred100 = #8B0000FF
gray100 = #808080FF

// === BASE FUNCTIONS ===
// Returns MA input selection variant, default to SMA if blank or typo.
variant(type, src, len, offSig, offALMA) =>
    v1 = ta.sma(src, len)  // Simple
    v2 = ta.ema(src, len)  // Exponential
    v3 = 2 * v2 - ta.ema(v2, len)  // Double Exponential
    v4 = 3 * (v2 - ta.ema(v2, len)) + ta.ema(ta.ema(v2, len), len)  // Triple Exponential
    v5 = ta.wma(src, len)  // Weighted
    v6 = ta.vwma(src, len)  // Volume Weighted
    v7 = 0.0
    sma_1 = ta.sma(src, len)  // Smoothed
    v7 := na(v7[1]) ? sma_1 : (v7[1] * (len - 1) + src) / len
    v8 = ta.wma(2 * ta.wma(src, len / 2) - ta.wma(src, len), math.round(math.sqrt(len)))  // Hull
    v9 = ta.linreg(src, len, offSig)  // Least Squares
    v10 = ta.alma(src, len, offALMA, offSig)  // Arnaud Legoux
    v11 = ta.sma(v1, len)  // Triangular (extreme smooth)
    // SuperSmoother filter
    // ©️ 2013 John F. Ehlers
    a1 = math.exp(-1.414 * 3.14159 / len)
    b1 = 2 * a1 * math.cos(1.414 * 3.14159 / len)
    c2 = b1
    c3 = -a1 * a1
    c1 = 1 - c2 - c3
    v12 = 0.0
    v12 := c1 * (src + nz(src[1])) / 2 + c2 * nz(v12[1]) + c3 * nz(v12[2])
    type == 'EMA' ? v2 : type == 'DEMA' ? v3 : type == 'TEMA' ? v4 : type == 'WMA' ? v5 : type == 'VWMA' ? v6 : type == 'SMMA' ? v7 : type == 'HullMA' ? v8 : type == 'LSMA' ? v9 : type == 'ALMA' ? v10 : type == 'TMA' ? v11 : type == 'SSMA' ? v12 : v1

// security wrapper for repeat calls
reso(exp, use, res) =>
    security_1 = request.security(syminfo.tickerid, res, exp, gaps=barmerge.gaps_off, lookahead=barmerge.lookahead_on)
    use ? security_1 : exp

// === /BASE FUNCTIONS ===

// === SERIES SETUP ===
closeSeries = variant(basisType, close[delayOffset], basisLen, offsetSigma, offsetALMA)
openSeries = variant(basisType, open[delayOffset], basisLen, offsetSigma, offsetALMA)
// === /SERIES ===

// === PLOTTING ===

// Get Alternate resolution Series if selected.
closeSeriesAlt = reso(closeSeries, useRes, stratRes)
openSeriesAlt = reso(openSeries, useRes, stratRes)
//
trendColour = closeSeriesAlt > openSeriesAlt ? color.green : color.red
bcolour = closeSeries > openSeriesAlt ? lime100 : red100
barcolor(scolor ? bcolour : na, title='Bar Colours')
closeP = plot(closeSeriesAlt, title='Close Series', color=trendColour, linewidth=2, style=plot.style_line, transp=20)
openP = plot(openSeriesAlt, title='Open Series', color=trendColour, linewidth=2, style=plot.style_line, transp=20)
fill(closeP, openP, color=trendColour, transp=80)

// === /PLOTTING ===
//
//
// === ALERT conditions
xlong = ta.crossover(closeSeriesAlt, openSeriesAlt)
xshort = ta.crossunder(closeSeriesAlt, openSeriesAlt)
longCond = xlong  // alternative: longCond[1]? false : (xlong or xlong[1]) and close>closeSeriesAlt and close>=open
shortCond = xshort  // alternative: shortCond[1]? false : (xshort or xshort[1]) and close<closeSeriesAlt and close<=open
// === /ALERT conditions.

// === STRATEGY ===
// stop loss
slPoints = input.int(defval=0, title='Initial Stop Loss Points (zero to disable)', minval=0)
tpPoints = input.int(defval=0, title='Initial Target Profit Points (zero for disable)', minval=0)
// Include bar limiting algorithm
ebar = input.int(defval=10000, title='Number of Bars for Back Testing', minval=0)
dummy = input(false, title='- SET to ZERO for Daily or Longer Timeframes')
//
// Calculate how many mars since last bar
tdays = (timenow - time) / 60000.0  // number of minutes since last bar
tdays := timeframe.ismonthly ? tdays / 1440.0 / 5.0 / 4.3 / timeframe.multiplier : timeframe.isweekly ? tdays / 1440.0 / 5.0 / timeframe.multiplier : timeframe.isdaily ? tdays / 1440.0 / timeframe.multiplier : tdays / timeframe.multiplier  // number of bars since last bar
//
//set up exit parameters
TP = tpPoints > 0 ? tpPoints : na
SL = slPoints > 0 ? slPoints : na

// Make sure we are within the bar range, Set up entries and exit conditions
if (ebar == 0 or tdays <= ebar) and tradeType != 'NONE'
    strategy.entry('long', strategy.long, when=longCond == true and tradeType != 'SHORT')
    strategy.entry('short', strategy.short, when=shortCond == true and tradeType != 'LONG')
    strategy.close('long', when=shortCond == true and tradeType == 'LONG')
    strategy.close('short', when=longCond == true and tradeType == 'SHORT')
    strategy.exit('XL', from_entry='long', profit=TP, loss=SL)
    strategy.exit('XS', from_entry='short', profit=TP, loss=SL)

// === /STRATEGY ===
// eof