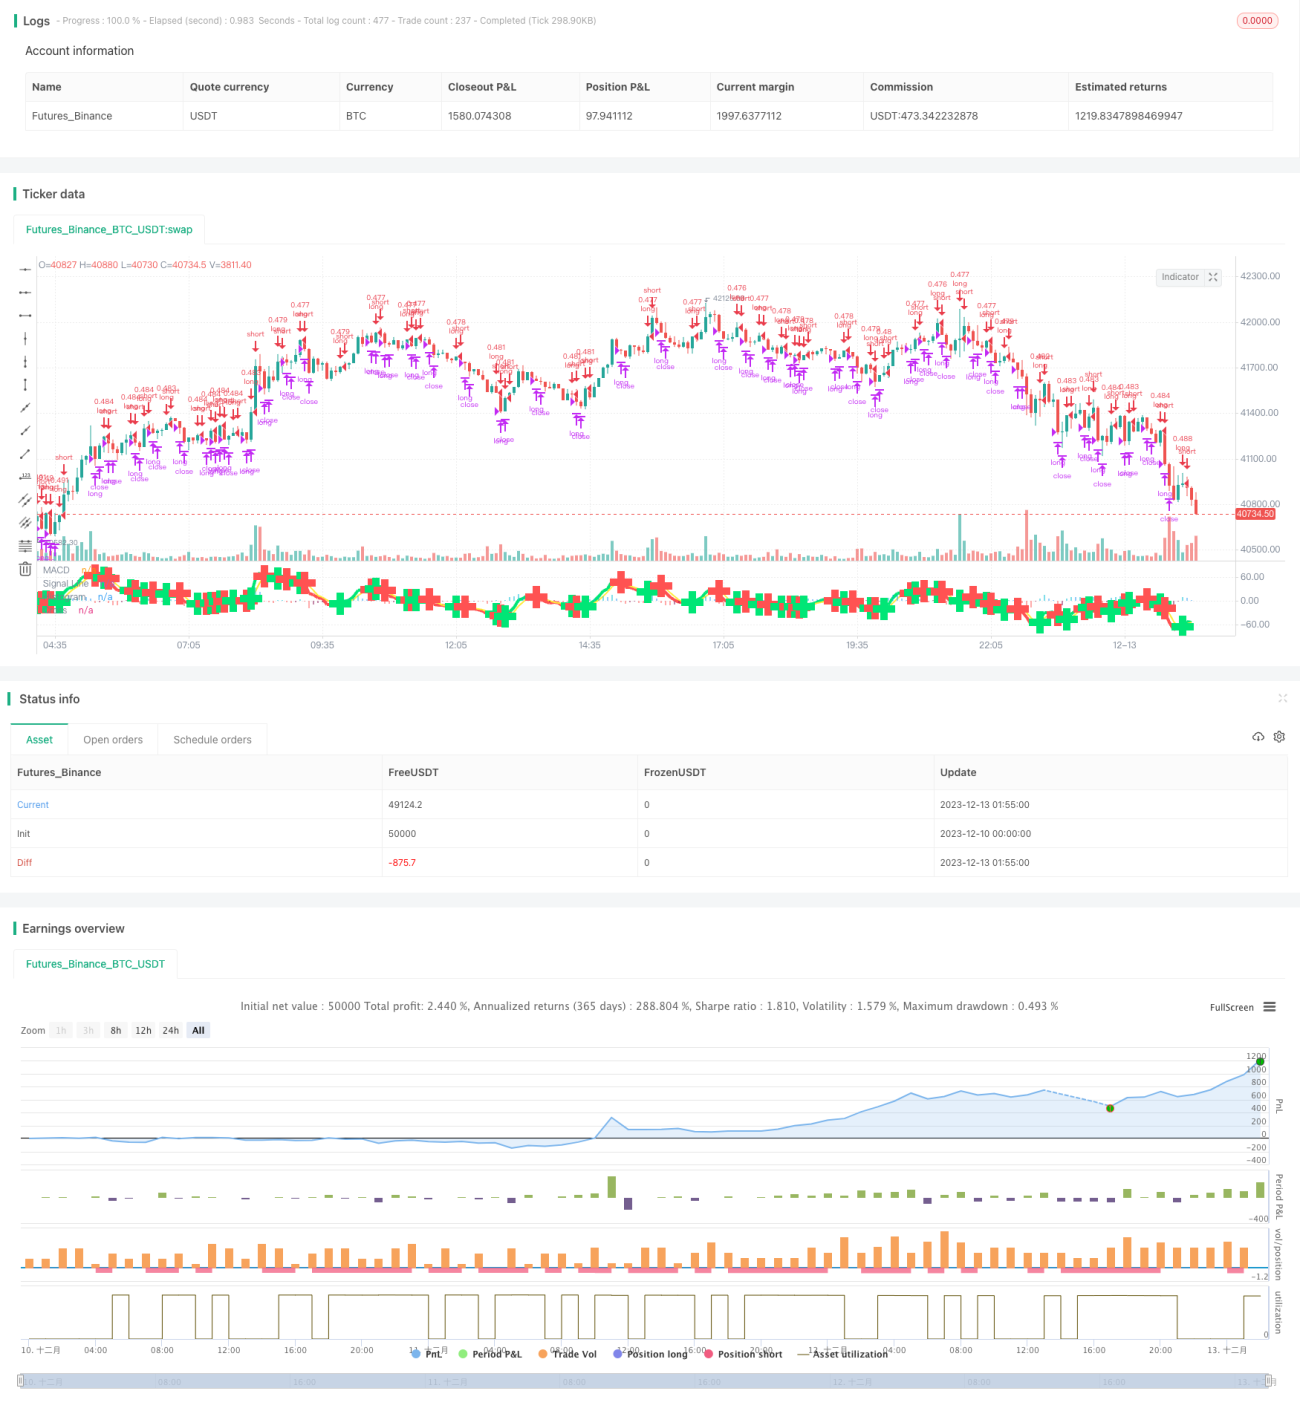
MACD 双動平均追跡戦略

作者: リン・ハーンチャオチャン, 日付: 2023-12-18 12:25:13
タグ:

img

概要

この戦略はMACD 双動平均追跡戦略取引シグナルとしてMACD指標の黄金十字と二重移動平均の死十字を使用し,前日の最低価格とストップ・ロスを組み合わせて短期的な価格動きを追跡します.

戦略の論理

  1. 速 EMA (近,5),遅 EMA (近8) と信号 SMA (MACD,3) を計算する
  2. 長い信号を定義する: 速いMAが遅いMAを超えると
  3. ショートシグナルを定義します. 急速なMAが遅いMAを下回り,閉じる価格が前日の最低価格より低いとき
  4. ポジションの大きさは,初期資本 2000 USD を閉じる価格で割る.
  5. ストップ損失としてロングポジションを閉じるためにショート信号を使用します.

利点分析

  1. MACD インディケーターを使用して,過剰購入と過剰販売ゾーンを決定し,偽のブレイクを避けるため,二重MAsで取引信号を形成します.
  2. 短期的なトレンドを追跡し,タイミングでストップ・ロスをする
  3. ポジションサイズをダイナミックに調整することで,過度に大きな単一の損失を避ける.

リスク分析

  1. MACD指標は遅延効果があり,短期的な機会を逃す可能性があります
  2. 2つのMA取引信号は偽信号を生む可能性があります.
  3. ストップ・ロストポイントは攻撃的すぎます ストップ・アウトの頻度は高いです

オプティマイゼーションの方向性

  1. インディケーターの感度向上のためにMACDパラメータの組み合わせを最適化
  2. 市場統合からの誤った信号を避けるために傾向判断を追加する
  3. 市場変動を評価するために波動性指数と組み合わせ,ストップ損失点を調整する

概要

この戦略は,過買い・過売りゾーンを決定するために,クラシックMACDの二重移動平均組合せ指標を使用し,ダイナミックなポジションサイジングと前日の最低価格をストップ・ロストポイントデザインとして導入し,取引信号を生成し,短期的な価格変動を把握する.全体的な戦略論理は明確で理解しやすく,さらなるテストと最適化に価値がある.


/*backtest
start: 2023-12-10 00:00:00
end: 2023-12-13 02:00:00
period: 5m
basePeriod: 1m
exchanges: [{"eid":"Futures_Binance","currency":"BTC_USDT"}]
*/

//@version=2
// macd/cam v1 strategizing Chris Moody Macd indicator https://www.tradingview.com/script/OQx7vju0-MacD-Custom-Indicator-Multiple-Time-Frame-All-Available-Options/
// macd/cam v2 changing to macd 5,8,3
// macd/cam v2.1 
//      Sell when lower than previous day low. 
//      Initial capital of $2k. Buy/sell quantity of initial capital / close price
//      Quitar short action
//      Note: custom 1-week resolution seems to put AMD at 80% profitable

strategy(title="MACD/CAM 2.1", shorttitle="MACD/CAM 2.1") //
source = close
//get inputs from options
useCurrentRes = input(true, title="Use Current Chart Resolution?")
resCustom = input(title="Use Different Timeframe? Uncheck Box Above", defval="60")
smd = input(true, title="Show MacD & Signal Line? Also Turn Off Dots Below")
sd = input(true, title="Show Dots When MacD Crosses Signal Line?")
sh = input(true, title="Show Histogram?")
macd_colorChange = input(true,title="Change MacD Line Color-Signal Line Cross?")
hist_colorChange = input(true,title="MacD Histogram 4 Colors?")
venderLowerPrev = input(true,title="Vender cuando closing price < previous day low?")

res = useCurrentRes ? timeframe.period : resCustom

fastLength = input(5, minval=1), slowLength=input(8,minval=1)
signalLength=input(3,minval=1)

// find exponential moving average of price as x and fastLength var as y
fastMA = ema(source, fastLength)
slowMA = ema(source, slowLength)

macd = fastMA - slowMA
// simple moving average
signal = sma(macd, signalLength)
hist = macd - signal

outMacD = request.security(syminfo.tickerid, res, macd)
outSignal = request.security(syminfo.tickerid, res, signal)
outHist = request.security(syminfo.tickerid, res, hist)

histA_IsUp = outHist > outHist[1] and outHist > 0
histA_IsDown = outHist < outHist[1] and outHist > 0
histB_IsDown = outHist < outHist[1] and outHist <= 0
histB_IsUp = outHist > outHist[1] and outHist <= 0

//MacD Color Definitions
macd_IsAbove = outMacD >= outSignal
macd_IsBelow = outMacD < outSignal

plot_color = hist_colorChange ? histA_IsUp ? aqua : histA_IsDown ? blue : histB_IsDown ? red : histB_IsUp ? maroon :yellow :gray
macd_color = macd_colorChange ? macd_IsAbove ? lime : red : red
signal_color = macd_colorChange ? macd_IsAbove ? yellow : yellow : lime

circleYPosition = outSignal
 
plot(smd and outMacD ? outMacD : na, title="MACD", color=macd_color, linewidth=4)
plot(smd and outSignal ? outSignal : na, title="Signal Line", color=signal_color, style=line ,linewidth=2)
plot(sh and outHist ? outHist : na, title="Histogram", color=plot_color, style=histogram, linewidth=4)

circleCondition = sd and cross(outMacD, outSignal)

// Determine long and short conditions
longCondition  = circleCondition and macd_color == lime

redCircle = circleCondition and macd_color == red
redCirclePrevLow = redCircle or low<low[1]
shortCondition = redCircle
if (venderLowerPrev)
    shortCondition = redCirclePrevLow

strategy.initial_capital = 20000
// Set quantity to initial capital / closing price
cantidad = strategy.initial_capital/close

// Submit orders
strategy.entry(id="long", long=true, qty=cantidad, when=longCondition)
strategy.close(id="long", when=shortCondition)
plot(circleCondition ? circleYPosition : na, title="Cross", style=cross, linewidth=10, color=macd_color)
// hline(0, '0 Line', linestyle=solid, linewidth=2, color=white)

もっと