強気エングルフィング売買戦略
作成日:
2023-12-27 14:25:11
最終変更日:
2023-12-27 14:25:11
コピー:
0
クリック数:
868
1
フォロー
1750
フォロワー
概要
バリッシュ・エングルフィン (Bullish Engulfing) は,株価の逆転の機会を捉え, K 線形を認識して利益を得るための量的な取引戦略である.
この戦略の主な利点は
- 熟練した技術分析理論に基づいて,高い確率の価格逆転の機会を識別する
- シンプルで直感的な取引信号
- リスクはコントロールできます
戦略原則
この策略は,K線形状をベースに価格の逆転を判断する.
株が下落傾向にあるとき,もし1つの実体より小さな陰線K線が現れ,その後の1つの実体が前K線の実体を完全に呑み込み,閉盘価格が前K線の最高価格より高くなった場合,それは,価格が反転し,株価が上昇することを予告するBullish Engulfing大陽吞食を形成する.
この戦略は,Bullish Engulfingの形が認識されるときに多額のポジションを開き,ストップ・ストップ・ストップ・エクジットを設定し,利益1%を目標とし,損失1%をストップし,利益をロックします.
戦略的優位分析
この戦略の利点は以下の通りです.
- 熟練した技術分析理論に基づいて,ブルリッシュ・エングルフィングは,価格逆転の機会を効果的に捉える可能性の高い価格逆転信号である.
- 取引シグナルはシンプルで直感的で,理解しやすい実装で,量化取引に適しています.
- 株価指数期貨などの流動性の高い品種を採用することで,高効率の出入を可能にすることができる.
- ストップ・ストップ・ストップ・エグジット (Exit) を設定すると,単一取引の利回り率をよくコントロールでき,利益の減少を保証し,大きな損失を回避できます.
- 戦略のパラメータは,異なる品種と市場環境に対応して柔軟に調整できます.
戦略的リスク分析
この戦略にはいくつかのリスクがあります.
- 技術分析理論によると,誤信号の危険性がある.
- 市場条件の変化によりパラメータが失効し,調整が必要となる.
- 止損設定が小さすぎると,小さな止損が起こり,大きすぎると,損失が増加する可能性があります.
リスクに対する対策は以下の通りです.
- パラメータを最適化し,異なる市場での有効性を検証する.
- ストップを拡大し,単一のストップを許容範囲で管理する.
- インデックスや株式指数期貨などの流動性があり,波動率が適度な取引品.
戦略最適化の方向性
この戦略は,以下の点で最適化できます.
- 傾向指標のフィルターと組み合わせて,例えば平均線判断を加え,逆転取引を避ける.
- 利回り率を上げ,利得を拡大する.
- ストップ・メカニズムを最適化します.例えば,価格の動きに伴いストップ・メカニズムを段階的に高め,ストップ・メカニズムの可能性を減らします.
- Bullish Engulfingのような他のK線形状の組み合わせを用いて,取引ポートフォリオを形成する.
要約する
Bullish Engulfing買取り戦略は,成熟した技術分析に基づく量化取引戦略であり,取引シグナルが簡潔で明快で,実行しやすいなどの利点があります.パラメータ最適化,リスク管理措置が置かれた場合,安定した利益を達成することができます.これは推奨されます.
ストラテジーソースコード
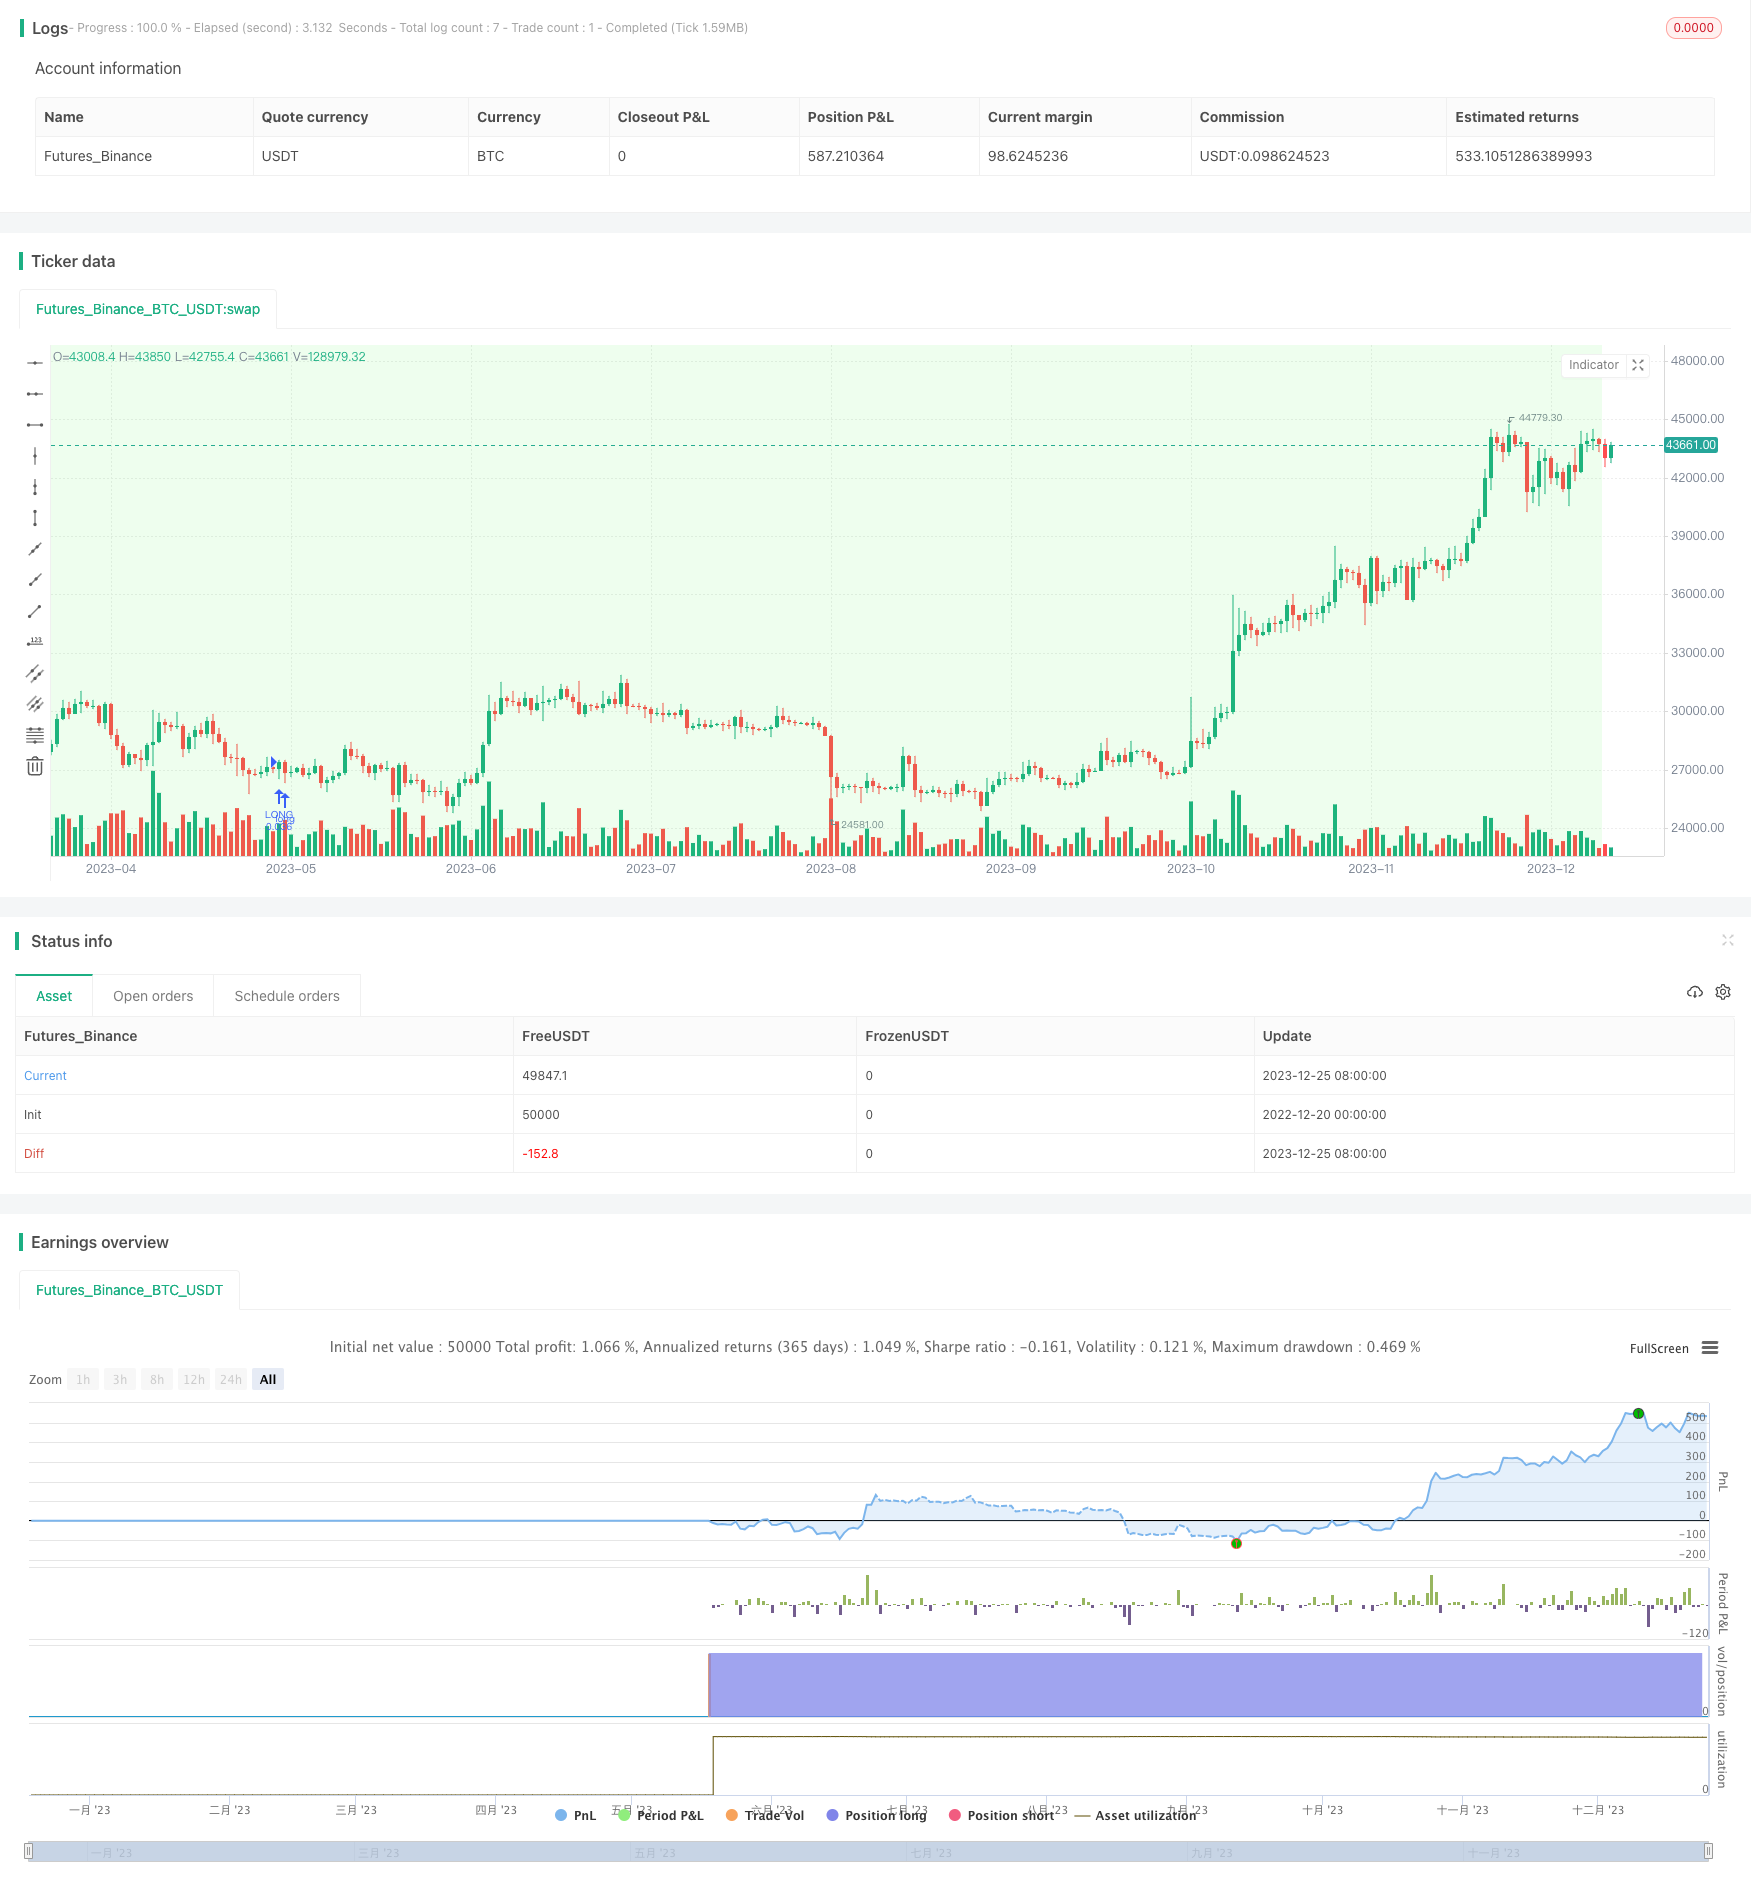
/*backtest
start: 2022-12-20 00:00:00
end: 2023-12-26 00:00:00
period: 1d
basePeriod: 1h
exchanges: [{"eid":"Futures_Binance","currency":"BTC_USDT"}]
*/

// This source code is subject to the terms of the Mozilla Public License 2.0 at https://mozilla.org/MPL/2.0/
// © thequantscience

// ██████╗ ██╗   ██╗██╗     ██╗     ██╗███████╗██╗  ██╗    ███████╗███╗   ██╗ ██████╗ ██╗   ██╗██╗     ███████╗██╗███╗   ██╗ ██████╗
// ██╔══██╗██║   ██║██║     ██║     ██║██╔════╝██║  ██║    ██╔════╝████╗  ██║██╔════╝ ██║   ██║██║     ██╔════╝██║████╗  ██║██╔════╝
// ██████╔╝██║   ██║██║     ██║     ██║███████╗███████║    █████╗  ██╔██╗ ██║██║  ███╗██║   ██║██║     █████╗  ██║██╔██╗ ██║██║  ███╗
// ██╔══██╗██║   ██║██║     ██║     ██║╚════██║██╔══██║    ██╔══╝  ██║╚██╗██║██║   ██║██║   ██║██║     ██╔══╝  ██║██║╚██╗██║██║   ██║
// ██████╔╝╚██████╔╝███████╗███████╗██║███████║██║  ██║    ███████╗██║ ╚████║╚██████╔╝╚██████╔╝███████╗██║     ██║██║ ╚████║╚██████╔╝
// ╚═════╝  ╚═════╝ ╚══════╝╚══════╝╚═╝╚══════╝╚═╝  ╚═╝    ╚══════╝╚═╝  ╚═══╝ ╚═════╝  ╚═════╝ ╚══════╝╚═╝     ╚═╝╚═╝  ╚═══╝ ╚═════╝

//@version=5
strategy(
     "Buy&Sell Bullish Engulfing - The Quant Science",
     overlay = true,
     default_qty_type = strategy.percent_of_equity,
     default_qty_value = 100,
     pyramiding = 1,
     currency = currency.EUR,
     initial_capital = 10000,
     commission_type = strategy.commission.percent,
     commission_value = 0.07,
     process_orders_on_close = true,
     close_entries_rule = "ANY"
     )

startDate  = input.int(title="D: ", defval=1,    minval=1,    maxval=31,   inline = 'Start', group = "START DATE BACKTESTING", tooltip = "D is Day, M is Month, Y is Year.")
startMonth = input.int(title="M: ", defval=1,    minval=1,    maxval=12,   inline = 'Start', group = "START DATE BACKTESTING", tooltip = "D is Day, M is Month, Y is Year.")
startYear  = input.int(title="Y: ", defval=2022, minval=1800, maxval=2100, inline = 'Start', group = "START DATE BACKTESTING", tooltip = "D is Day, M is Month, Y is Year.")

endDate    = input.int(title="D: ", defval=31,   minval=1,    maxval=31,   inline = 'End',   group = "END DATE BACKTESTING", tooltip = "D is Day, M is Month, Y is Year.")
endMonth   = input.int(title="M: ", defval=12,   minval=1,    maxval=12,   inline = 'End',   group = "END DATE BACKTESTING", tooltip = "D is Day, M is Month, Y is Year.")
endYear    = input.int(title="Y: ", defval=2023, minval=1800, maxval=2100, inline = 'End',   group = "END DATE BACKTESTING", tooltip = "D is Day, M is Month, Y is Year.")

inDateRange = (time >= timestamp(syminfo.timezone, startYear, startMonth, startDate, 0, 0)) and (time < timestamp(syminfo.timezone, endYear, endMonth, endDate, 0, 0))

PROFIT   = input.float(defval = 1, minval = 0, title = "Target profit (%): ", step = 0.10, group = "TAKE PROFIT-STOP LOSS")
STOPLOSS = input.float(defval = 1, minval = 0, title = "Stop Loss (%): ",     step = 0.10, group = "TAKE PROFIT-STOP LOSS")

var float equity_trades = 0
strategy.initial_capital = 50000
equity_trades := strategy.initial_capital
var float equity   = 0
var float qty_order   = 0
t_ordersize = "Percentage size of each new order. With 'Reinvestment Profit' activate, the size will be calculate on the equity, with 'Reinvestment Profit' deactivate the size will be calculate on the initial capital."
orders_size = input.float(defval = 2, title = "Orders size (%): ", minval = 0.10, step = 0.10,  maxval = 100, group = "RISK MANAGEMENT", tooltip = t_ordersize)
qty_order := ((equity_trades * orders_size) / 100 ) / close

C_DownTrend = true
C_UpTrend   = true
var trendRule1 = "SMA50"
var trendRule2 = "SMA50, SMA200"
var trendRule = input.string(trendRule1, "Detect Trend Based On", options=[trendRule1, trendRule2, "No detection"], group = "BULLISH ENGULFING")

if trendRule == trendRule1
	priceAvg = ta.sma(close, 50)
	C_DownTrend := close < priceAvg
	C_UpTrend := close > priceAvg

if trendRule == trendRule2
	sma200 = ta.sma(close, 200)
	sma50  = ta.sma(close, 50)
	C_DownTrend := close < sma50 and sma50 < sma200
	C_UpTrend := close > sma50 and sma50 > sma200
C_Len = 14
C_ShadowPercent = 5.0
C_ShadowEqualsPercent = 100.0
C_DojiBodyPercent = 5.0
C_Factor = 2.0

C_BodyHi = math.max(close, open)
C_BodyLo = math.min(close, open)
C_Body = C_BodyHi - C_BodyLo
C_BodyAvg = ta.ema(C_Body, C_Len)
C_SmallBody = C_Body < C_BodyAvg
C_LongBody = C_Body > C_BodyAvg
C_UpShadow = high - C_BodyHi
C_DnShadow = C_BodyLo - low
C_HasUpShadow = C_UpShadow > C_ShadowPercent / 100 * C_Body
C_HasDnShadow = C_DnShadow > C_ShadowPercent / 100 * C_Body
C_WhiteBody = open < close
C_BlackBody = open > close
C_Range = high-low
C_IsInsideBar = C_BodyHi[1] > C_BodyHi and C_BodyLo[1] < C_BodyLo
C_BodyMiddle = C_Body / 2 + C_BodyLo
C_ShadowEquals = C_UpShadow == C_DnShadow or (math.abs(C_UpShadow - C_DnShadow) / C_DnShadow * 100) < C_ShadowEqualsPercent and (math.abs(C_DnShadow - C_UpShadow) / C_UpShadow * 100) < C_ShadowEqualsPercent
C_IsDojiBody = C_Range > 0 and C_Body <= C_Range * C_DojiBodyPercent / 100
C_Doji = C_IsDojiBody and C_ShadowEquals

patternLabelPosLow  = low  - (ta.atr(30) * 0.6)
patternLabelPosHigh = high + (ta.atr(30) * 0.6)

label_color_bullish = input.color(color.rgb(43, 255, 0), title = "Label Color Bullish", group = "BULLISH ENGULFING")
C_EngulfingBullishNumberOfCandles = 2
C_EngulfingBullish = C_DownTrend and C_WhiteBody and C_LongBody and C_BlackBody[1] and C_SmallBody[1] and close >= open[1] and open <= close[1] and ( close > open[1] or open < close[1] )
if C_EngulfingBullish
    var ttBullishEngulfing = "Engulfing\nAt the end of a given downward trend, there will most likely be a reversal pattern. To distinguish the first day, this candlestick pattern uses a small body, followed by a day where the candle body fully overtakes the body from the day before, and closes in the trend’s opposite direction. Although similar to the outside reversal chart pattern, it is not essential for this pattern to completely overtake the range (high to low), rather only the open and the close."
    label.new(bar_index, patternLabelPosLow, text="BE", style=label.style_label_up, color = label_color_bullish, textcolor=color.white, tooltip = ttBullishEngulfing)
bgcolor(ta.highest(C_EngulfingBullish?1:0, C_EngulfingBullishNumberOfCandles)!=0 ? color.new(#21f321, 90) : na, offset=-(C_EngulfingBullishNumberOfCandles-1))

var float c       = 0
var float o       = 0
var float c_exit  = 0
var float c_stopl = 0

if C_EngulfingBullish and strategy.opentrades==0 and inDateRange
    c := strategy.equity
    o := close
    c_exit  := c + (c * PROFIT / 100)
    c_stopl := c - (c * STOPLOSS / 100)
    strategy.entry(id = "LONG", direction = strategy.long, qty = qty_order, limit = o)

if ta.crossover(strategy.equity, c_exit)
    strategy.exit(id = "CLOSE-LONG", from_entry = "LONG", limit = close)
if ta.crossunder(strategy.equity, c_stopl)
    strategy.exit(id = "CLOSE-LONG", from_entry = "LONG", limit = close)