フィボナッチHMAに基づくAI売買シグナル戦略
概要
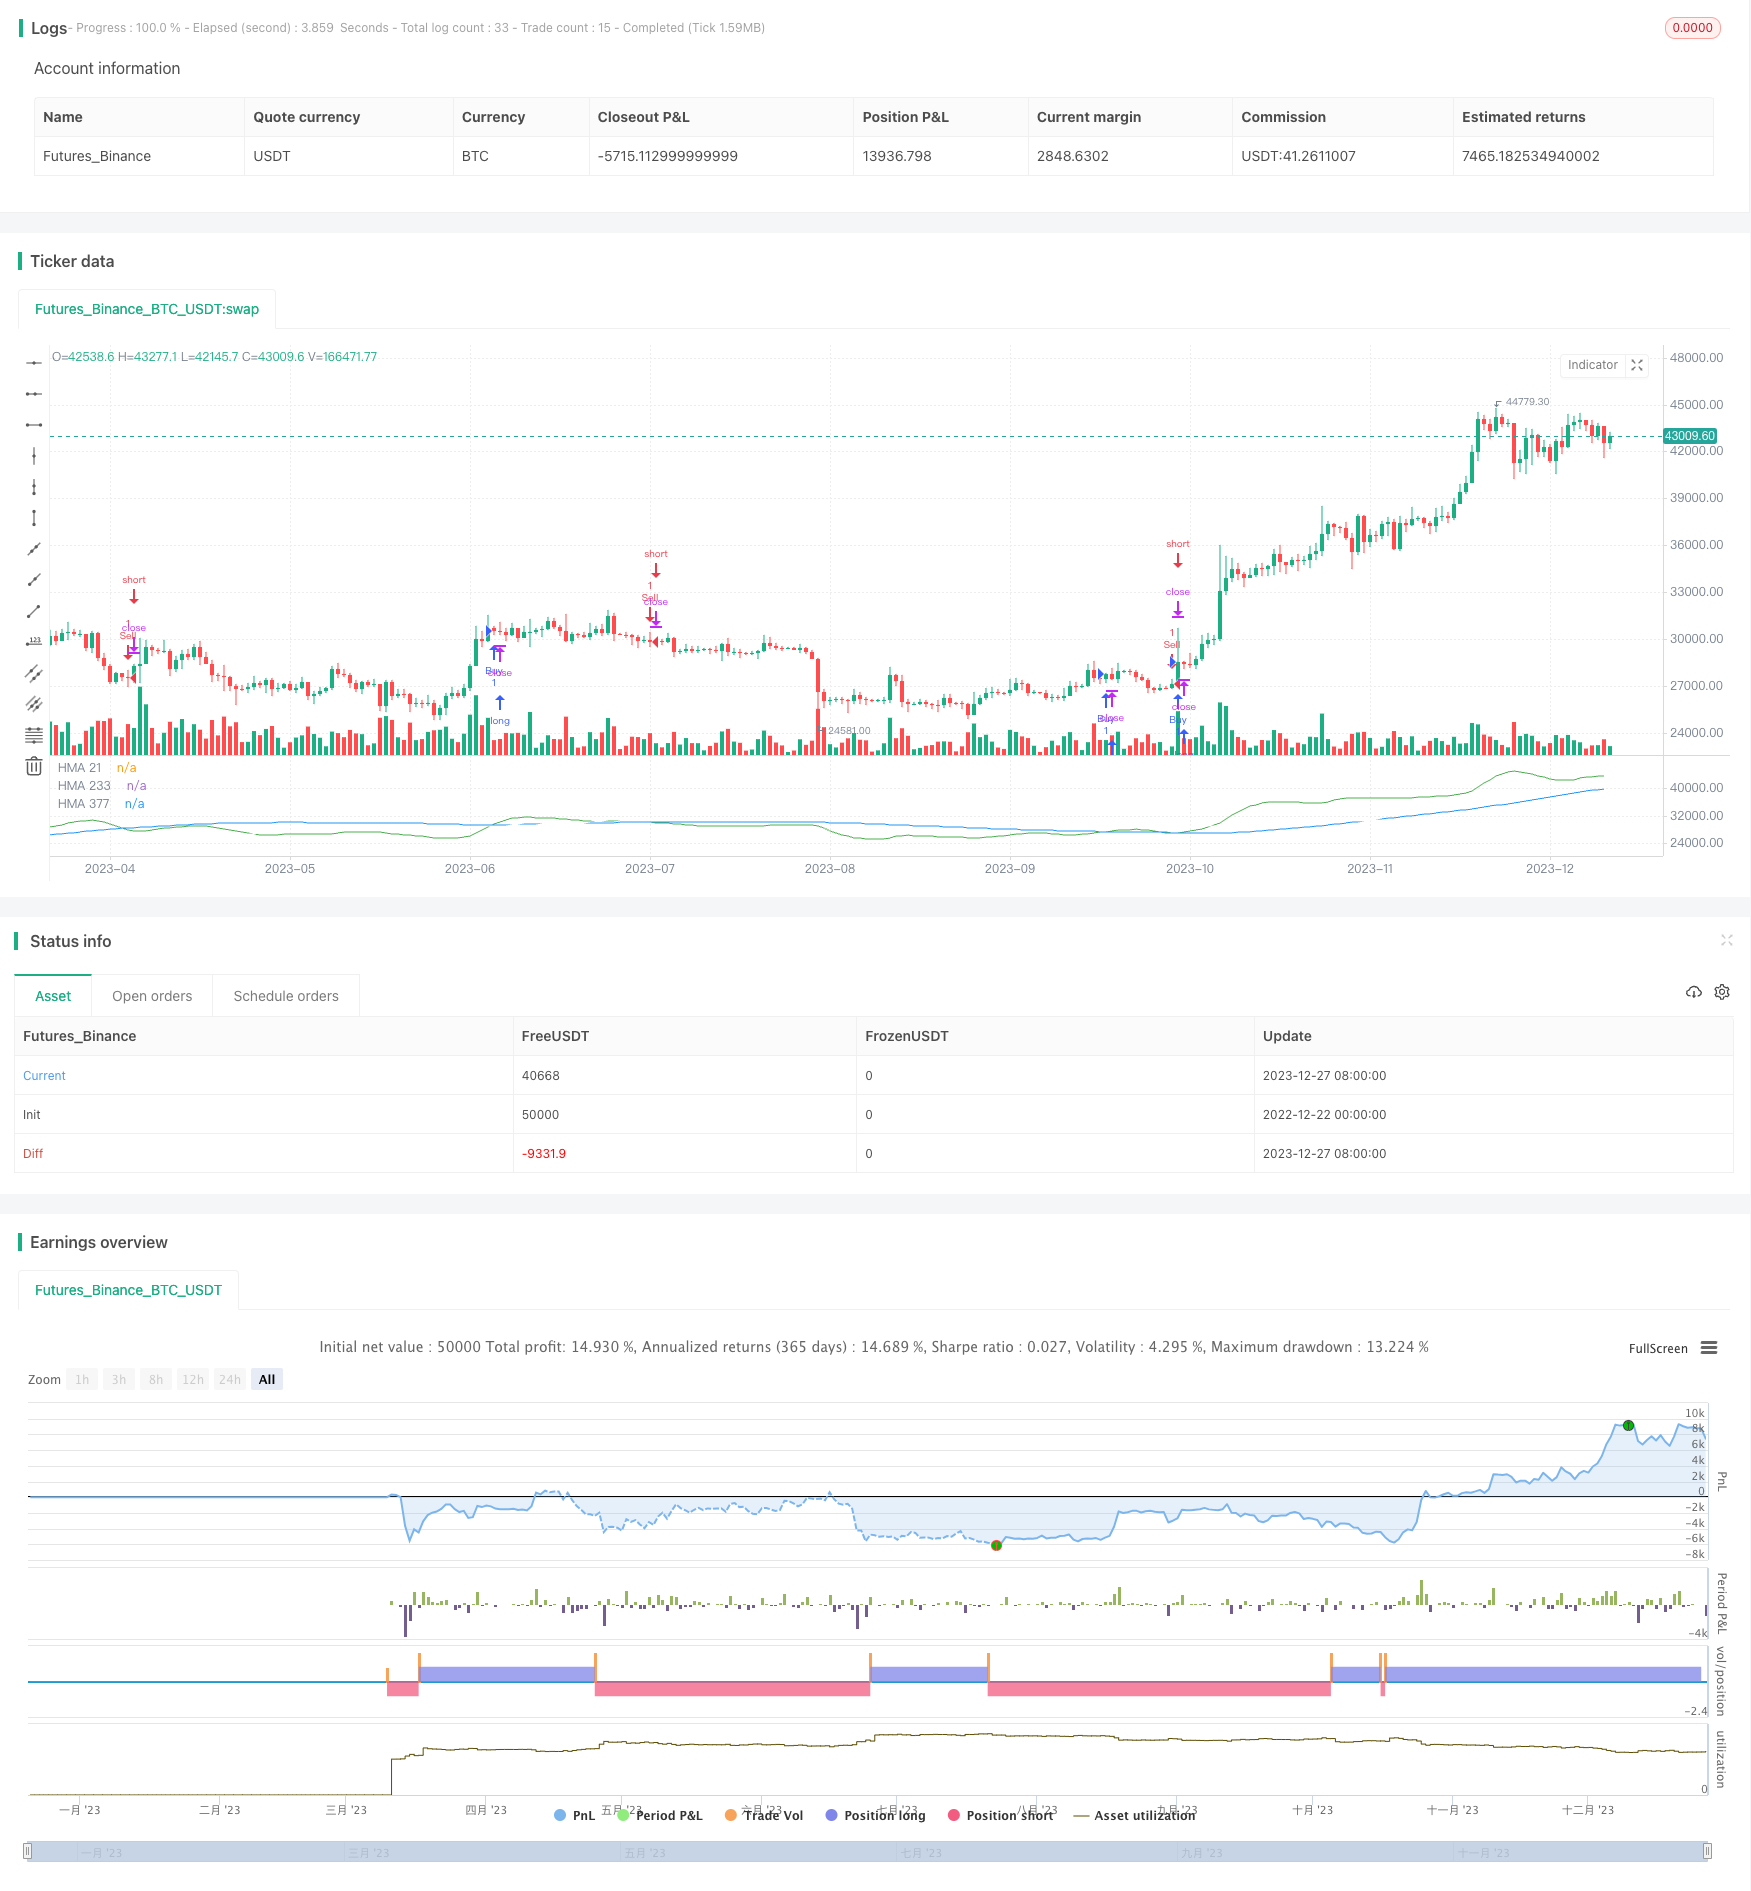
この戦略は,潜在的な買入と売却のシグナルを識別するために,フィボナッチ数列に基づくハル移動平均 (HMA) の取引戦略を導入している.この戦略は,フィボナッチ数列に関連する特定のHMAラインを適用し,取引環境における可能な入場と退出の点について洞察を提供することを目的としている.
戦略原則
この戦略は,フィボナッチ数列の数字1,2および3に関連した独特のHMA線,すなわちHMA 1,HMA 2およびHMA 3を使用します. これらのHMA線が交差すると,自動の買入と売却の信号が生成されます. 例えば,HMA 3の上をHMA 2を穿越すると買入の信号が生成され,HMA 3の下をHMA 2を穿越すると売却の信号が生成されます. これらのHMA線は,取引機会を容易に識別するために,異なる色で視覚的に表示されます.
優位分析
この戦略は,フィボナッチ分析とハル移動平均の利点を組み合わせている.フィボナッチ分析は,重要なサポートとレジスタンス位置を識別するために使用でき,HMAラインの平らな価格データは,騒音を軽減し,より信頼性の高い取引信号を生成する.さらに,この戦略は,視覚的表示を簡素化し,トレンドの始まりと終わりを容易に判断します.
リスク分析
この戦略は,価格の変動時に誤信号を生じることがあります.また,パラメータの設定が不適切であることも戦略のパフォーマンスに影響を与えます.異なる市場環境に対応するためにHMAラインの周期長さを調整する必要があります.
最適化の方向
他の指標,例えばRSIと組み合わせたシグナルフィルタリングは,誤ったシグナルを避けるために考慮することができます.さらに,異なるパラメータの組み合わせの実際の取引パフォーマンスをテストして,最適なパラメータを決定することができます.この戦略を他の取引戦略の組み合わせと組み合わせて使用することもできます.
要約する
この戦略は,金融市場におけるフィボナッチ数列の適用の優位性を充分活用し,HMA指標の信号フィルタリング能力と組み合わせて,潜在的なトレンドを検出するための効果的なツールを形成している.この戦略は,シンプルで直感的で,実行しやすいであり,さらなるテストと最適化の価値があります.
/*backtest
start: 2022-12-22 00:00:00
end: 2023-12-28 00:00:00
period: 1d
basePeriod: 1h
exchanges: [{"eid":"Futures_Binance","currency":"BTC_USDT"}]
*/

//@version=4
// © Blackynator
strategy("AI Fibonacci HMA Strategy | Buy / Sell Indicator")

// Set the parameters for the moving averages
hma377Period = 377
hma233Period = 233
hma21Period = 21

// Calculate the moving averages
hma377 = hma(close, hma377Period)
hma233 = hma(close, hma233Period)
hma21 = hma(close, hma21Period)

// Plot the moving averages on the chart with different colors and titles
plot(hma377, color=color.white, title="HMA 377")
plot(hma233, color=color.blue, title="HMA 233")
plot(hma21, color=color.green, title="HMA 21")

// Create variables to hold the HMA 21 value and its previous value
hmaValue = hma21
hmaValuePrev = nz(hmaValue[1], hmaValue)

// Create variables to hold the HMA 200 value and its previous value
hma233Value = hma233
hma233ValuePrev = nz(hma233Value[1], hma233Value)

// Check if the HMA 21 has crossed up the HMA 200 and create a buy signal if it has
if (hmaValue > hma233Value) and (hmaValuePrev < hma233ValuePrev)
    strategy.entry("Buy", true)

// Check if the HMA 21 has crossed down the HMA 200 and create a sell signal if it has
if (hmaValue < hma233Value) and (hmaValuePrev > hma233ValuePrev)
    strategy.entry("Sell", false)