二重機関定量的反転追跡戦略
概要
この戦略は,双機関指標の優位性を総合的に利用し,123形状判断反転信号を採用し,正量指数判断量能信号を補足し,短線反転の動きを捕捉する.
戦略原則
123形判定 逆信号
9日Stoch指標を用いた快線と慢線の構築
終盤価格が2日連続で下落し,第3日終盤価格が上昇し,ストック速線が50を下回ったとき,買取シグナルが生じる
閉店価格が2日連続で上昇し,閉店価格が3日連続で低下し,ストーフ速線が50を超えるとセールシグナルが生じる
定量指数判断量能信号
正量指数 (PVI) は,前日と今日の取引量変化を比較して判断できる.
PVI上でのN日移動平均を穿越すると,指示値は拡大され,買取信号が生成される.
PVIの下の N 日移動平均を横切ると,指示量は縮小し,出売シグナルを生成する
2つの信号の総合判断
- 123反転信号とPVI量能信号が同方向に発信される時のみ,取引信号が生成される
全体として,この戦略は,両機関の指標の優位性を最大限に活用し,ショートラインの価格逆転の機会を効果的に識別します.
優位分析
123形状判定,重要な短線反転点を捉える
PVI量能指標,量価配合を判断し,偽突破を避ける
ストッチ指標のパラメータを最適化して,大部分の不動領域の無効信号をフィルターします.
双信号結合は,単一信号より信頼性が高い
昼間判断により,夜間リスクを回避し,短線操作に適した
リスク分析
失敗するリスク
- 123形反転信号は常に有効ではなく,形失敗のリスクがある
失敗するリスク
- Stoch と PVI のような指標は,特定の異常な状況下では無効になります.
双重シグナルを無視するリスク
- 同方向双方向信号条件はより厳しいため,部分的な単方向信号の機会を逃す可能性があります.
取引頻度リスク
- 戦略的な取引の頻度が高いため,ポジションと風力制御を注意深く監視する必要があります.
最適化の方向
パラメータの最適化スペースが大きい
- ストッチウィンドウ期,PVI周期数などのパラメータには最適化スペースがあります.
ストップ・ロスの戦略
- モバイル・ストップ・ラスト・アシュアランス戦略を組み合わせる勝率
フィルタリング条件を考慮する
- 平均線,波動率などの波指標をテストできます.
双信号組合せを最適化する
- より多くの二重指数の組み合わせの利をテストできます
要約する
この戦略は,ストック指数とPVI指数の組み合わせによって,高い信頼性のショートライン量値逆転取引戦略を形成する.単一の指数と比較して,より高い勝利率と正の期待を持っている.パラメータ最適化と風力制御設定により,シャープ比率をさらに拡大することができる.全体的に,この戦略は,双機関指数の優位性を利用し,市場の短期逆転機会を効果的に捕捉することができ,実験的に最適化することが価値がある.
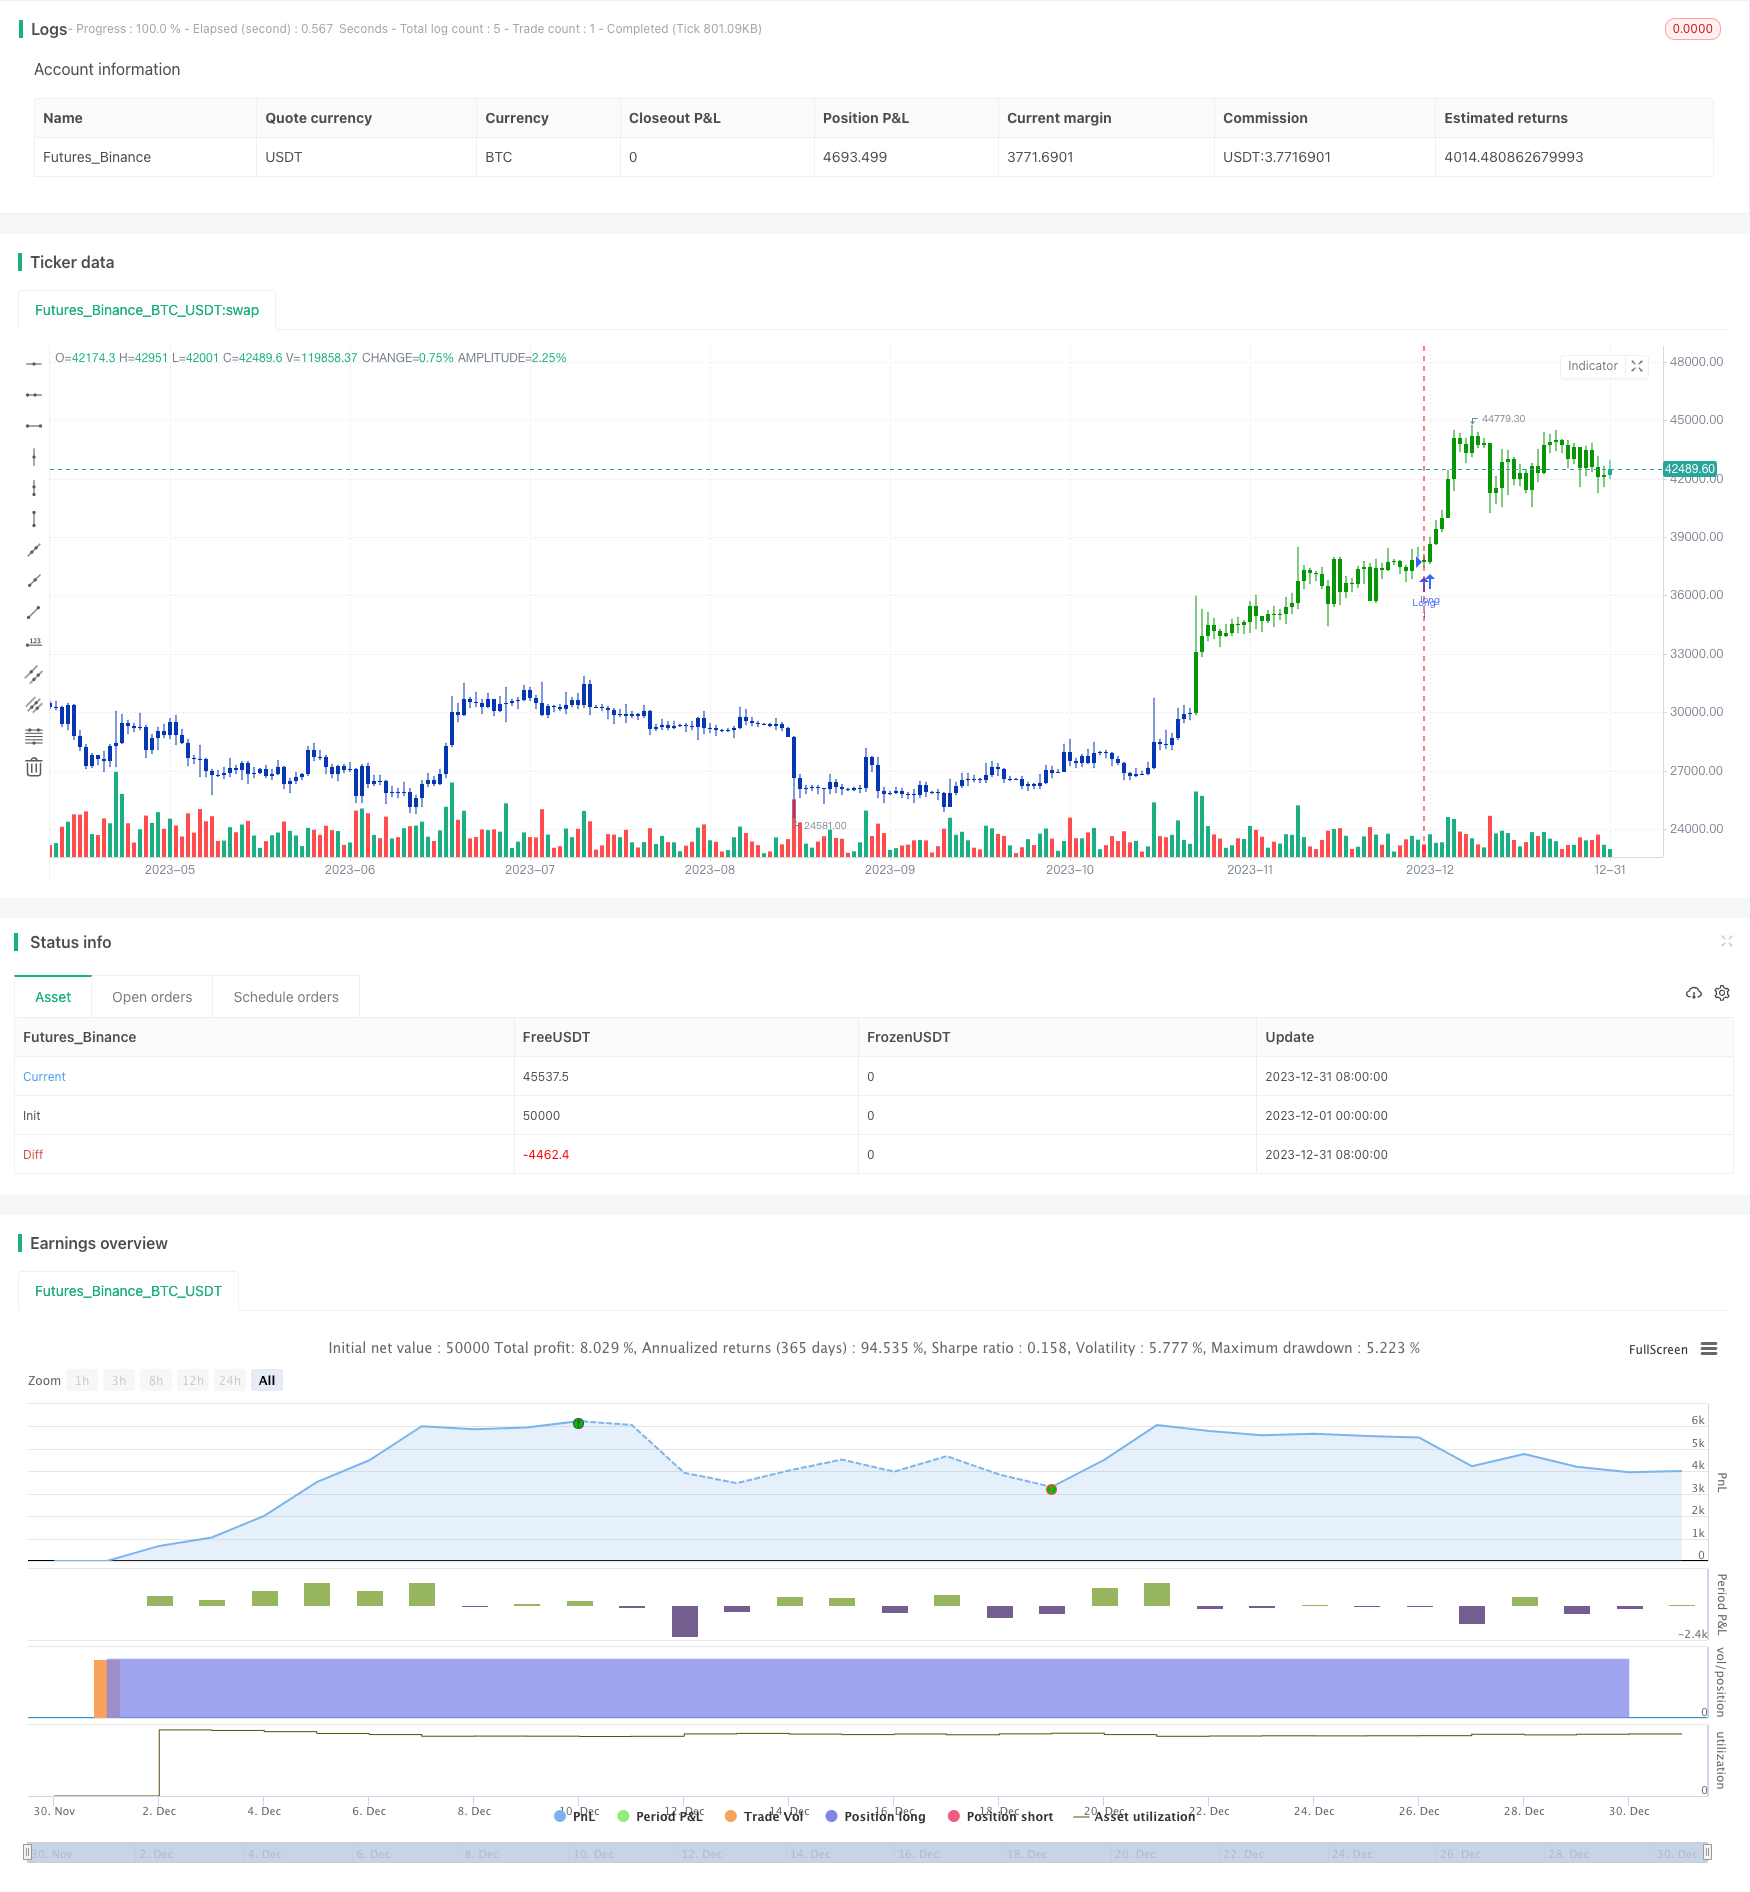
/*backtest
start: 2023-12-01 00:00:00
end: 2023-12-31 23:59:59
period: 1d
basePeriod: 1h
exchanges: [{"eid":"Futures_Binance","currency":"BTC_USDT"}]
*/

//@version=4
////////////////////////////////////////////////////////////
//  Copyright by HPotter v1.0 22/04/2021
// This is combo strategies for get a cumulative signal.
//
// First strategy
// This System was created from the Book "How I Tripled My Money In The
// Futures Market" by Ulf Jensen, Page 183. This is reverse type of strategies.
// The strategy buys at market, if close price is higher than the previous close
// during 2 days and the meaning of 9-days Stochastic Slow Oscillator is lower than 50.
// The strategy sells at market, if close price is lower than the previous close price
// during 2 days and the meaning of 9-days Stochastic Fast Oscillator is higher than 50.
//
// Second strategy
// The theory behind the indexes is as follows: On days of increasing volume,
// you can expect prices to increase, and on days of decreasing volume, you can
// expect prices to decrease. This goes with the idea of the market being in-gear
// and out-of-gear. Both PVI and NVI work in similar fashions: Both are a running
// cumulative of values, which means you either keep adding or subtracting price
// rate of change each day to the previous day`s sum. In the case of PVI, if today`s
// volume is less than yesterday`s, don`t add anything; if today`s volume is greater,
// then add today`s price rate of change. For NVI, add today`s price rate of change
// only if today`s volume is less than yesterday`s.
//
// WARNING:
// - For purpose educate only
// - This script to change bars colors.
////////////////////////////////////////////////////////////
Reversal123(Length, KSmoothing, DLength, Level) =>
    vFast = sma(stoch(close, high, low, Length), KSmoothing)
    vSlow = sma(vFast, DLength)
    pos = 0.0
    pos := iff(close[2] < close[1] and close > close[1] and vFast < vSlow and vFast > Level, 1,
	         iff(close[2] > close[1] and close < close[1] and vFast > vSlow and vFast < Level, -1, nz(pos[1], 0)))
	pos


PVI(EMA_Len) =>
    pos = 0.0
    xROC = roc(close, 1)
    nRes = 0.0
    nResEMA = 0.0
    nRes := iff(volume > volume[1], nz(nRes[1], 0) + xROC, nz(nRes[1], 0))
    nResEMA := ema(nRes, EMA_Len)
    pos := iff(nRes > nResEMA, 1,
        	 iff(nRes < nResEMA, -1, nz(pos[1], 0)))
    pos

strategy(title="Combo Backtest 123 Reversal & Positive Volume Index", shorttitle="Combo", overlay = true)
line1 = input(true, "---- 123 Reversal ----")
Length = input(14, minval=1)
KSmoothing = input(1, minval=1)
DLength = input(3, minval=1)
Level = input(50, minval=1)
//-------------------------
line2 = input(true, "---- Positive Volume Index ----")
EMA_Len = input(255, minval=1)
reverse = input(false, title="Trade reverse")
posReversal123 = Reversal123(Length, KSmoothing, DLength, Level)
posPVI = PVI(EMA_Len)
pos = iff(posReversal123 == 1 and posPVI == 1 , 1,
	   iff(posReversal123 == -1 and posPVI == -1, -1, 0))
possig = iff(reverse and pos == 1, -1,
          iff(reverse and pos == -1 , 1, pos))
if (possig == 1 )
    strategy.entry("Long", strategy.long)
if (possig == -1 )
    strategy.entry("Short", strategy.short)
if (possig == 0)
    strategy.close_all()
barcolor(possig == -1 ? #b50404: possig == 1 ? #079605 : #0536b3 )