戦略とバイ・アンド・ホールドの視覚的な比較
概要
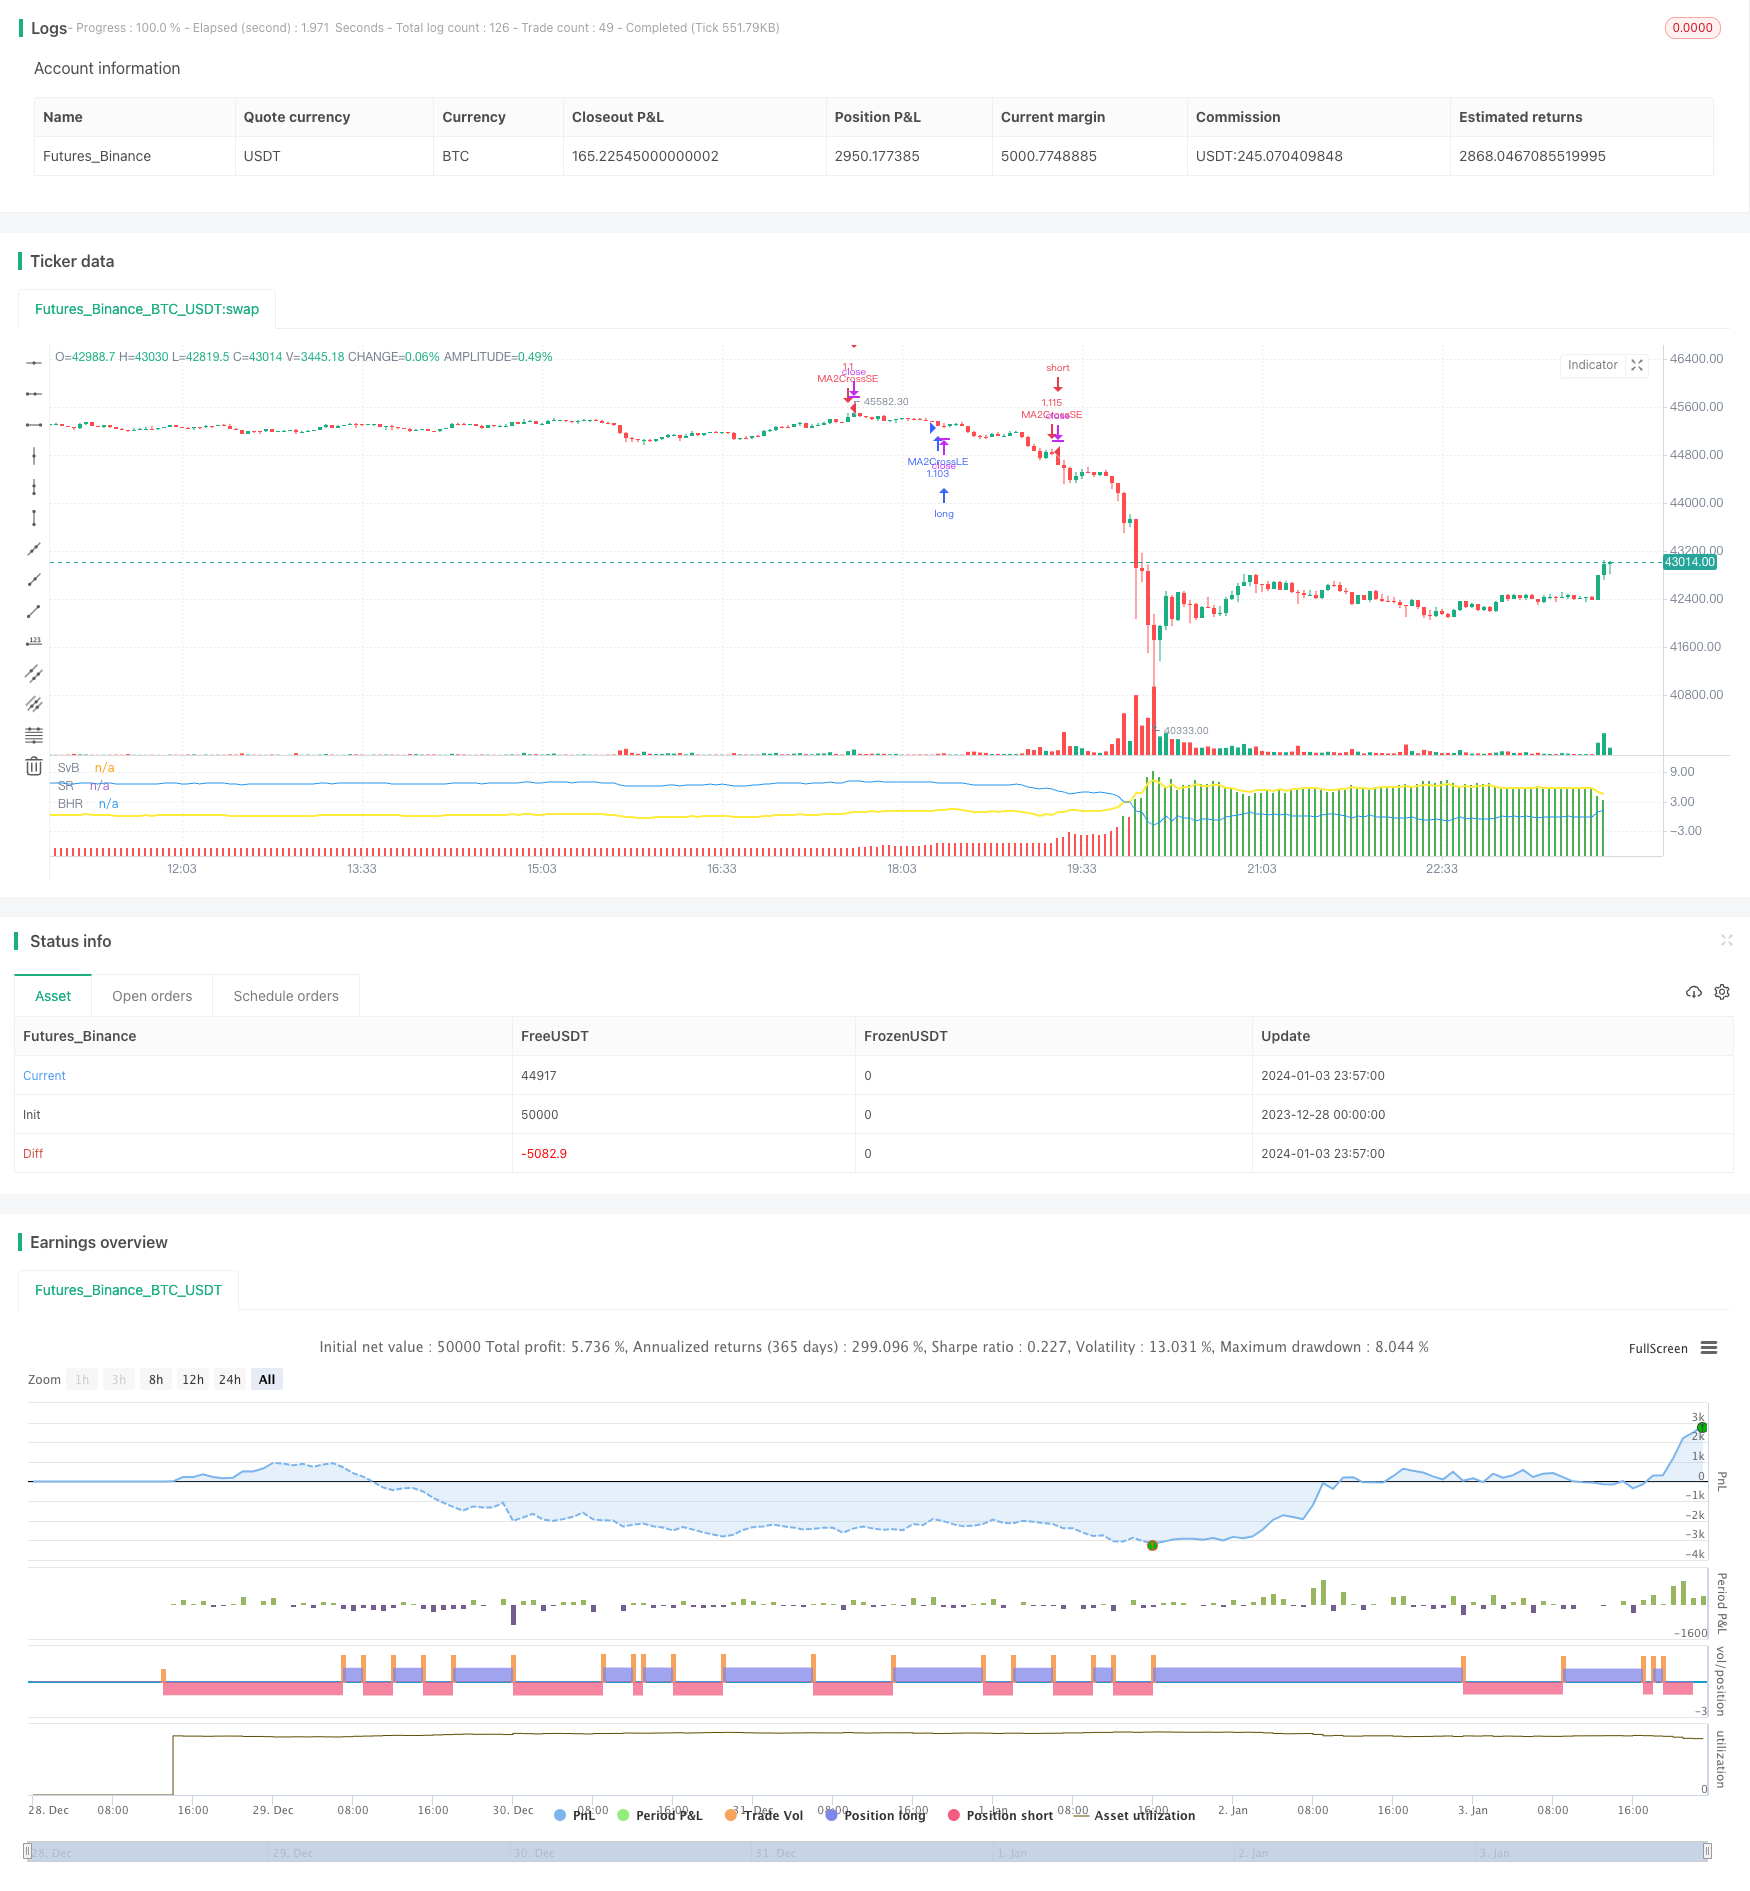
この戦略は,詳細な指標とグラフを使用して,特定の戦略と取引された証券の購入と保有の利益を直観的に比較します.
戦略原則
この戦略の核心的な論理は,与えられた戦略と買入保有戦略の差異を比較する4つの重要な要素を描画することです.
- 戦略の純利益: 戦略の純利益と未達成利益の合計
- 購入と保有の純利益:収益化されていない
- 差値:戦略的純利益 - 買いと保有の純利益
- 戦略 VS 統計指標の購入と所有
- 戦略的な純利益は,購入した持っていたBarの百分比よりも高い
- 戦略的な純利益は,購入した持有するBarのパーセント以下です.
- 戦略と購入保有の平均差
この4つの要素を比較することで,戦略と単純に購入・保有の優劣をはっきりと直感的に理解できます.
戦略的優位分析
この戦略は,単純に買入と保有の利益の比較と比較して,以下の利点があります.
より包括的で詳細な比較指標.各Kラインの比較,全体的な統計の比較など,戦略が勝ったり負ったりした場所をより明確に知ることができます.
直観的な比較グラフ. 戦略の純利益,買入保有純利益,両者の差値のグラフを描画することで,戦略のパフォーマンスをより素早く視覚的に判断することができます.
カスタマイズ可能な比較期間 戦略のパフォーマンスをよりよく分析するために,特定の時間帯で購入と保有との比較のみに焦点を当てることを選択できます.
シンプルで使いやすい。このポリシーは,完全な比較論理を内蔵しており,私たちは自分のポリシーのコードをテンプレート内の対応する位置に代入するだけでよい。比較論理を自分で書く必要がありません。
リスク分析
この戦略は,主に取引プラットフォームに搭載された買入保有収益指標を比較する.この内蔵指標に偏差がある場合,最終的な比較結果に影響を与える.さらに,戦略の統計指標の計算方法にも欠陥があり,戦略と買入保有の比較状況を100%正確に反映できない.
より多くの基準と比較し,より多くの統計的方法の導入などの手段によって,戦略のパフォーマンスをさらに検証することができます.取引プラットフォームのアップグレード後に購入と保有の収益指標が大きな偏差を生じた場合,戦略の比較論理を調整する必要もあります.
最適化の方向
この戦略は以下の点で最適化できます.
3方または多方比較のためのより多くの基準を追加します.例えば,対等指数または業界指標の比較を追加できます.
より多くの統計指標を追加します. 例えば,年間,四半期,最大撤退時間差などです. より多くの次元から戦略を理解することができます.
参数化配置を追加. 比較の時間帯以外のコンテンツをカスタマイズできるようにする. 比較基準,統計指標など.
グラフの表示を最適化する.現在の簡単な線図の表示は,戦略と購入保有が特定の時点のどの時点で比較されているかを明確に見ることが困難である場合,柱状の図を描くか,読みやすさを高めるために標識を追加することを考えることができます.
要約する
この戦略は,複数の詳細な比較指標と直観的なグラフ表示を設計することで,カスタム戦略と単純な買い持つの戦略の違いを非常に明確に全面的に理解することができ,その戦略のパフォーマンスをより良く改善するのに役立ちます.そのカスタム可能な比較時間帯は,さまざまな段階での戦略の優劣を柔軟に分析することができます.
比較基準,統計指標,グラフ表示をさらに強化すれば,この戦略は極めて強力な戦略分析ツールとなるでしょう. それは,戦略分析と改善の作業をより効率的にするために,テンプレートとフレームワークを提供します.
/*backtest
start: 2023-12-28 00:00:00
end: 2024-01-04 00:00:00
period: 3m
basePeriod: 1m
exchanges: [{"eid":"Futures_Binance","currency":"BTC_USDT"}]
*/

//@version=4
strategy("VS Buy Hold", precision=2)

bnh_info_panel = input(true, title='Enable Info Panel')
bnh_indicator_panel = input(true, title='Enable Indicator Panel')

//COMPARISON DATE RANGE//
bnh_FromYear = input(1970, title="From Year", minval=1970)
bnh_FromMonth = input(1, title="From Month", minval=1, maxval=12)
bnh_FromDay = input(1, title="From Day", minval=1, maxval=31)

bnh_ToYear = input(2050, title="To Year", minval=2010)
bnh_ToMonth = input(12, title="To Month", minval=1, maxval=12)
bnh_ToDay = input(31, title="To Day", minval=1, maxval=31)

bnh_start = timestamp(bnh_FromYear, bnh_FromMonth, bnh_FromDay, 00, 00)
bnh_finish = timestamp(bnh_ToYear, bnh_ToMonth, bnh_ToDay, 23, 59)
bnh_timeCond = time >= bnh_start and time <= bnh_finish ? true: false

//Note: If you are going to use the COMPARISON DATE RANGE above, apply bnh_timeCond
//      to your strategy parameters.


/////////////////////////////////////////////////////////////////////////////////////
//////////////////////////////STRATEGY SCRIPT START//////////////////////////////////

//=========================PLACEHOLDER MA CROSS STRATEGY=========================//
fastLength = 50
slowLength = 200
price = close

mafast = sma(price, fastLength)
maslow = sma(price, slowLength)
strategy.initial_capital = 50000
positionSize = strategy.initial_capital / close

if (crossover(mafast, maslow) and bnh_timeCond) // <= bnh_timeCond added as a condition
    strategy.entry("MA2CrossLE", strategy.long, positionSize, comment="MA2CrossLE")

if (crossunder(mafast, maslow) and bnh_timeCond) // <= bnh_timeCond added as a condition
    strategy.entry("MA2CrossSE", strategy.short, positionSize, comment="MA2CrossSE")

//////////////////////////////STRATEGY SCRIPT END////////////////////////////////////
/////////////////////////////////////////////////////////////////////////////////////


//STRATEGY EQUITY
strategy_pnl = strategy.netprofit + strategy.openprofit
bnh_strategy_pnl_pcnt = (strategy_pnl / strategy.initial_capital) * 100


//BUY AND HOLD EQUITY
float bnh_start_bar = na
bnh_start_bar := na(bnh_start_bar[1]) and bnh_timeCond? close : bnh_start_bar[1]
bnl_buy_hold_equity = ((close - bnh_start_bar)/bnh_start_bar) * 100


//STRATEGY VS BUY AND HOLD STATS
bnh_vs_diff = bnh_strategy_pnl_pcnt - bnl_buy_hold_equity

bnh_bar_counter = 0
bnh_bar_counter := bnh_vs_diff > 0 ? nz(bnh_bar_counter[1]) + 1 : bnh_bar_counter[1]

bnh_bar_counter2 = 0
bnh_bar_counter2 := bnh_vs_diff <= 0 ? nz(bnh_bar_counter2[1]) + 1 : bnh_bar_counter2[1]

bnh_pcnt_above = (bnh_bar_counter/(bnh_bar_counter + bnh_bar_counter2))*100
bnh_pcnt_below = (bnh_bar_counter2/(bnh_bar_counter + bnh_bar_counter2))*100

bnh_average_diff = cum(bnh_vs_diff) / (bnh_bar_counter + bnh_bar_counter2)


//PLOTS AND LABELS
bnh_diff_color = bnh_vs_diff > 0 ? color.green : color.red
plot(bnh_vs_diff, style=plot.style_columns, color=bnh_diff_color, transp=60, title='SvB')
plot(bnh_strategy_pnl_pcnt, color=color.yellow, linewidth=2, title="SR")
plot(bnl_buy_hold_equity, color=color.blue, title="BHR")

// draw_IndicatorLabel(_text, _x, _y, label_color, font_color)=>
//     string_text = _text
//     var label la_indicator = na
//     label.delete(la_indicator)
//     la_indicator := label.new(
//          x=_x, y=_y,
//          text=string_text, xloc=xloc.bar_index, yloc=yloc.price,
//          color=label_color, style=label.style_labeldown, textcolor=font_color, size=size.small)

// draw_InfoPanel(_text, _x, _y, font_size)=>
//     var label la_panel = na
//     label.delete(la_panel)
//     la_panel := label.new(
//          x=_x, y=_y,
//          text=_text, xloc=xloc.bar_time, yloc=yloc.price,
//          color=color.new(#383838, 5), style=label.style_labelup, textcolor=color.white, size=font_size)

// if bnh_indicator_panel
//     draw_IndicatorLabel("Difference", bar_index, bnh_vs_diff, color.new(color.gray, 40), color.white)
//     draw_IndicatorLabel("Strategy P/L", bar_index, bnh_strategy_pnl_pcnt, color.new(color.yellow, 50), color.white)
//     draw_IndicatorLabel("Buy & Hold P/L", bar_index, bnl_buy_hold_equity, color.new(color.blue, 50), color.white)

// info_panel_x = time_close + round(change(time) * 200)
// info_panel_y = max(max(bnl_buy_hold_equity, bnh_strategy_pnl_pcnt), bnh_vs_diff) + abs(bnh_vs_diff * 0.25)


// title = "STRATEGY vs BUY & HOLD STATS"
// row0 = "-----------------------------------------------------"
// row1 = 'Bars Above Buy & Hold: ' + tostring(bnh_pcnt_above, '#.##') + '%'
// row2 = 'Bars Below Buy & Hold: ' + tostring(bnh_pcnt_below, '#.##') + '%'
// row3 = 'All Time Ave. Difference: ' + tostring(bnh_average_diff, '#.##') + '%'

// panel_text = '\n' + title + '\n' + row0 + '\n' + row1 + '\n\n' + row2 + '\n\n' + row3 + '\n'

// if bnh_info_panel
//     draw_InfoPanel(panel_text, info_panel_x, info_panel_y, size.normal)