
この戦略の主な考えは,より大きな時間枠でトレンドの方向を識別し,より小さな時間枠で突破点の入場を探すことであり,ストップ・エグジットは,より大きな時間枠で移動平均を追跡することである.
この戦略は主に3つの指標に基づいて判断されます.
第一に,より長い周期 (日線など) のX日のシンプル移動平均を計算し,その移動平均が価格ステーションにある時にのみ購入を許す.これは,全体的なトレンドの方向を判断して,取引の揺れ期を避けるために使用できる.
2つ目は,より短い周期 (例えば5日) 内の最高価格のSwing Highを計算し,価格がこの最高価格を破るときに買入シグナルを誘発する.
3つ目は,ストップラインを設定する. ポジションに入ると,ストップラインは,最近の低点から一定の周期lbStopの最低価格にロックする. また,出口機構として移動平均 (日線10日EMAのような) を設定し,価格が移動平均より低いときにポジションを退出する.
この戦略は,過剰なポイント購入を避けるためにATR値を設定します. また,再測定時間範囲などの他の補助条件があります.
この3つの指標の相互作用は,この戦略の核心的な論理を形成しています.
これは突破的な追跡戦略で,以下の利点があります.
2つのタイムフレームを使用し,波動的な市場の偽の突破に囚われないようにする.長いタイムフレームは,全体的なトレンドを判断し,短いタイムフレームは,特定の入場点を探す.
スウィングハイが形成される突破点を利用して,このような突破は一定の慣性を持ち,簡単に追跡できる.また,周期lbのパラメータを振り返って,本当に有効な突破を探すことができる.
止損は厳格な方法で,近年の低値を追跡し,一定の緩衝距離を残して,盤を避ける.
移動平均を退出メカニズムとして使用し,状況に応じて柔軟に停止することができます.
ATR指標は,過剰放出によるリスクを回避する.
異なるパラメータの組み合わせを設定して効果をテストし,最適化スペースを広げる.
この戦略にはいくつかのリスクがあります.
価格が移動平均の近くで上下振動するときは,繰り返し切替されやすい.このとき,高い手数料のリスクに直面する.
移動平均の近くで購入ポイントを突破すると,相対的に大きな撤回リスクがあります.これは戦略そのものの特徴です.
市場動向がはっきりしない場合,長期にわたって保有し,時間的なリスクに直面する可能性があります.
ATRパラメータを合理的に設定する必要があります.ATRが小さすぎるとフィルタリング効果が弱く,大きすぎると入場機会が減少します.
異なるlbパラメータが結果に影響を及ぼすことをテストする必要があります. 大きすぎるパラメータは,いくつかの機会を逃し,小さすぎるパラメータは,偽突破を認識する可能性があります.
リスク対策:
この戦略は以下の側面から最適化できます.
異なる移動平均のパラメータの組み合わせをテストし,最適なパラメータを探します.
異なるATRパラメータ設定を試し,入場機会とリスク管理をバランスさせる.
周期lbのパラメータを最適化して,より効率的な突破を識別する.
動的ストップを設定し,波動率と撤回によってリスクを制御する.
取引量指数などの他の要因と組み合わせて,突破の有効性を判断する.
極限点を参照として探す方法を開発する.
Machine Learning を使って,パラメータを訓練して,最適のパラメータを得ます.
この戦略の全体は,典型的な突破追跡戦略である。二時間枠判断,Swing Highの入場タイミング,止損線,移動平均の二重保険退出機構を識別し,完全な論理体系を形成している。この戦略のリスクと利益の特徴は,より明確であり,中長期線を追跡するタイプの投資家に適している。ある程度のリスクは存在するが,パラメータ最適化とルール最適化によってリスクレベルを低減することができる。この戦略には,改善の余地があり,より多くの指標判断と組み合わせれば,戦略の効果をさらに強化する可能性がある。
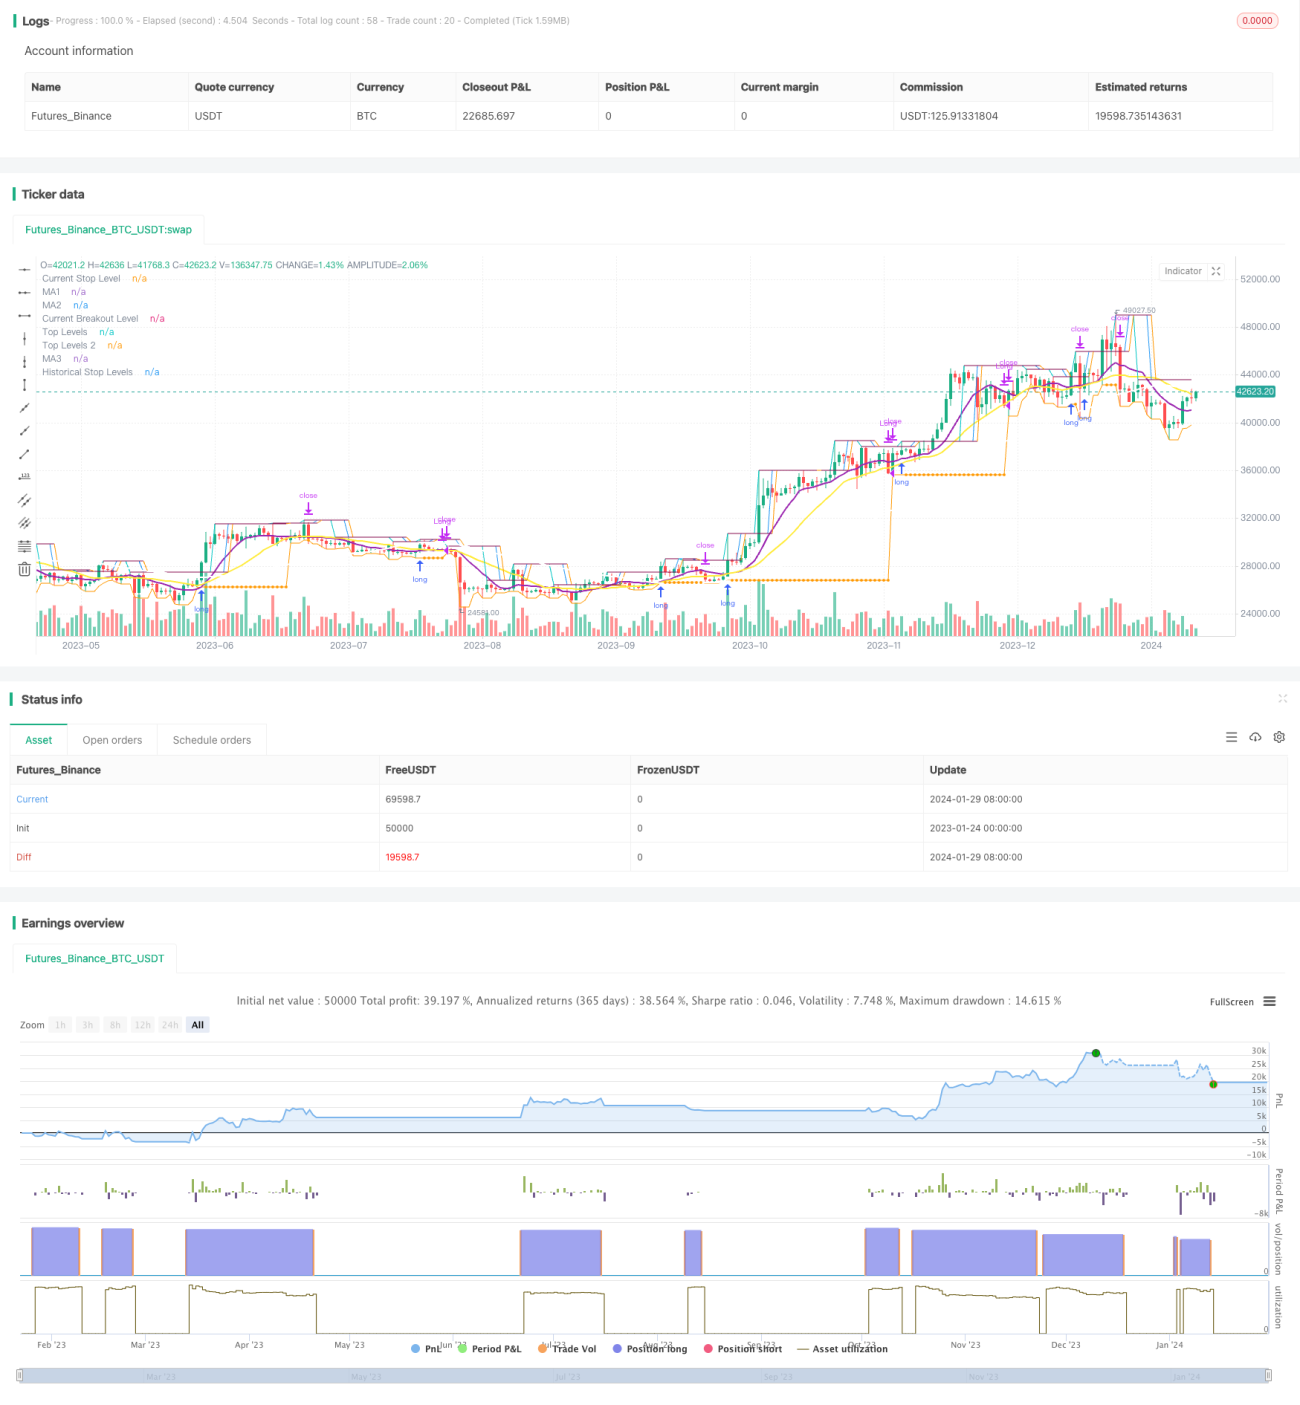
/*backtest
start: 2023-01-24 00:00:00
end: 2024-01-30 00:00:00
period: 1d
basePeriod: 1h
exchanges: [{"eid":"Futures_Binance","currency":"BTC_USDT"}]
*/
// This source code is subject to the terms of the Mozilla Public License 2.0 at https://mozilla.org/MPL/2.0/
// © millerrh
// The intent of this strategy is to buy breakouts with a tight stop on smaller timeframes in the direction of the longer term trend.
// Then use a trailing stop of a close below either the 10 MA or 20 MA (user choice) on that larger timeframe as the position
// moves in your favor (i.e. whenever position price rises above the MA).
// Option of using daily ATR as a measure of finding contracting ranges and ensuring a decent risk/reward.
// (If the difference between the breakout point and your stop level is below a certain % of ATR, it could possibly find those consolidating periods.)
//@version=4
strategy("Qullamaggie Breakout", overlay=true, initial_capital=10000, currency='USD',
default_qty_type=strategy.percent_of_equity, default_qty_value=100, commission_type=strategy.commission.percent, commission_value=0.1)
// === BACKTEST RANGE ===
Start = input(defval = timestamp("01 Jan 2019 06:00 +0000"), title = "Backtest Start Date", type = input.time)
Finish = input(defval = timestamp("01 Jan 2100 00:00 +0000"), title = "Backtest End Date", type = input.time)
// Inputs
lb = input(defval = 3, title = "Lookback Period for Swing High", minval = 1,
tooltip = "Lookback period for defining the breakout level.")
lbStop = input(defval = 3, title = "Lookback Bars for Stop Level", minval = 1,
tooltip = "Initial stop placement is the lowest low this many bars back. Allows for tighter stop placement than referencing swing lows.")
htf = input(defval="D", title="Timeframe of Moving Averages", type=input.resolution,
tooltip = "Allows you to set a different time frame for the moving averages. The default behavior is to identify good tightening setups on a larger timeframe
(like daily) and enter the trade on a breakout occuring on a smaller timeframe, using the moving averages of the larger timeframe to trail your stop.")
maType = input(defval="SMA", options=["EMA", "SMA"], title = "Moving Average Type")
ma1Length = input(defval = 10, title = "1st Moving Average Length", minval = 1)
ma2Length = input(defval = 20, title = "2nd Moving Average Length", minval = 1)
ma3Length = input(defval = 50, title = "3rd Moving Average Length", minval = 1)
useMaFilter = input(title = "Use 3rd Moving Average for Filtering?", type = input.bool, defval = true,
tooltip = "Signals will be ignored when price is under this slowest moving average. The intent is to keep you out of bear periods and only
buying when price is showing strength or trading with the longer term trend.")
trailMaInput = input(defval="2nd Moving Average", options=["1st Moving Average", "2nd Moving Average"], title = "Trailing Stop")
// MA Calculations
ma(maType, src, length) =>
maType == "EMA" ? ema(src, length) : sma(src, length) //Ternary Operator (if maType equals EMA, then do ema calc, else do sma calc)
ma1 = security(syminfo.tickerid, htf, ma(maType, close, ma1Length))
ma2 = security(syminfo.tickerid, htf, ma(maType, close, ma2Length))
ma3 = security(syminfo.tickerid, htf, ma(maType, close, ma3Length))
plot(ma1, color=color.purple, style=plot.style_line, title="MA1", linewidth=2, transp = 60)
plot(ma2, color=color.yellow, style=plot.style_line, title="MA2", linewidth=2, transp = 60)
plot(ma3, color=color.white, style=plot.style_line, title="MA3", linewidth=2, transp = 60)
// === USE ATR FOR FILTERING ===
// The idea here is that you want to buy in a consolodating range for best risk/reward. So here you can compare the current distance between
// support/resistance vs.the ATR and make sure you aren't buying at a point that is too extended from normal.
useAtrFilter = input(title = "Use ATR for Filtering?", type = input.bool, defval = false,
tooltip = "Signals will be ignored if the distance between support and resistance is larger than a user-defined percentage of Daily ATR.
This allows the user to ensure they are not buying something that is too extended and instead focus on names that are consolidating more.")
atrPerc = input(defval = 100, title = "% of Daily ATR Value", minval = 1)
atrValue = security(syminfo.tickerid, "D", atr(14))*atrPerc*.01
// === PLOT SWING HIGH/LOW AND MOST RECENT LOW TO USE AS STOP LOSS EXIT POINT ===
// Change these values to adjust the look back and look forward periods for your swing high/low calculations
pvtLenL = lb
pvtLenR = lb
// Get High and Low Pivot Points
pvthi_ = pivothigh(high, pvtLenL, pvtLenR)
pvtlo_ = pivotlow(low, pvtLenL, pvtLenR)
// Force Pivot completion before plotting.
Shunt = 1 //Wait for close before printing pivot? 1 for true 0 for flase
maxLvlLen = 0 //Maximum Extension Length
pvthi = pvthi_[Shunt]
pvtlo = pvtlo_[Shunt]
// Count How many candles for current Pivot Level, If new reset.
counthi = barssince(not na(pvthi))
countlo = barssince(not na(pvtlo))
pvthis = fixnan(pvthi)
pvtlos = fixnan(pvtlo)
hipc = change(pvthis) != 0 ? na : color.maroon
lopc = change(pvtlos) != 0 ? na : color.green
// Display Pivot lines
plot((maxLvlLen == 0 or counthi < maxLvlLen) ? pvthis : na, color=hipc, transp=0, linewidth=1, offset=-pvtLenR-Shunt, title="Top Levels")
// plot((maxLvlLen == 0 or countlo < maxLvlLen) ? pvtlos : na, color=lopc, transp=0, linewidth=1, offset=-pvtLenR-Shunt, title="Bottom Levels")
plot((maxLvlLen == 0 or counthi < maxLvlLen) ? pvthis : na, color=hipc, transp=0, linewidth=1, offset=0, title="Top Levels 2")
// plot((maxLvlLen == 0 or countlo < maxLvlLen) ? pvtlos : na, color=lopc, transp=0, linewidth=1, offset=0, title="Bottom Levels 2")
// BUY CONDITIONS
stopLevelCalc = valuewhen(pvtlo_, low[pvtLenR], 0) //Stop Level at Swing Low
buyLevel = valuewhen(pvthi_, high[pvtLenR], 0) //Buy level at Swing High
plot(buyLevel, style=plot.style_line, color=color.blue, title = "Current Breakout Level", show_last=1, linewidth=1, transp=50, trackprice=true)
// Conditions for entry and exit
stopLevel = float(na) // Define stop level here as "na" so that I can reference it in the inPosition
// variable and the ATR calculation before the stopLevel is actually defined.
buyConditions = (useMaFilter ? buyLevel > ma3 : true) and
(useAtrFilter ? (buyLevel - stopLevel[1]) < atrValue : true)
// buySignal = high > buyLevel and buyConditions
buySignal = crossover(high, buyLevel) and buyConditions
trailMa = trailMaInput == "1st Moving Average" ? ma1 : ma2
sellSignal = crossunder(close, trailMa)
// sellSignal = security(syminfo.tickerid, htf, close < trailMa) and security(syminfo.tickerid, htf, close[1] < trailMa)
// STOP AND PRICE LEVELS
inPosition = bool(na)
inPosition := buySignal[1] ? true : sellSignal[1] ? false : low <= stopLevel[1] ? false : inPosition[1]
lowDefine = lowest(low, lbStop)
stopLevel := inPosition ? stopLevel[1] : lowDefine
// plot(stopLevel)
buyPrice = buyLevel
buyPrice := inPosition ? buyPrice[1] : buyLevel
plot(stopLevel, style=plot.style_line, color=color.orange, title = "Current Stop Level", show_last=1, linewidth=1, transp=50, trackprice=true)
plot(inPosition ? stopLevel : na, style=plot.style_circles, color=color.orange, title = "Historical Stop Levels", transp=50, trackprice=false)
// plot(buyPrice, style=plot.style_line, color=color.blue, linewidth=1, transp=50, trackprice=true)
// (STRATEGY ONLY) Comment out for Study
strategy.entry("Long", strategy.long, stop = buyLevel, when = buyConditions)
strategy.exit("Exit Long", from_entry = "Long", stop=stopLevel[1])
if (low[1] > trailMa)
strategy.close("Long", when = sellSignal)
// if (low[1] > trailMa)
// strategy.exit("Exit Long", from_entry = "Long", stop=trailMa) //to get this to work right, I need to reference highest highs instead of swing highs
//because it can have me buy right back in after selling if the stop level is above the last registered swing high point.