개요
정밀 트렌드 돌파 트렌드 전략은 트렌드 지표와 특정 K 선 형태를 기반으로 돌파 트렌드를 정확하게 포착합니다. 이 전략은 평균선을 사용하여 트렌드 방향을 판단하고, RSI 지표는 과매매를 판단하며, 고급 K 선 형태와 결합하여 돌파 지점을 선택하여 트렌드의 정밀한 위치를 확인하고, 적절한 시기에 돌파 거래를 수행하여 초과 수익을 얻습니다.
전략 원칙
8일 EMA와 80일 EMA를 적용하여 트렌드 방향을 판단한다. 8일 EMA는 80일 EMA 위를 보이스라고 정의하고, 반대로 보이스라고 정의한다. 트렌드 방향이 일치하는 경우에만 거래 신호를 고려한다.
세 개의 K 선의 특정 조합 형태를 정의합니다. 즉, 첫 번째 K 선의 낮은 점은 두 번째 K 선보다 낮고, 세 번째 K 선의 낮은 점은 두 번째 K 선보다 낮습니다. 이 형태는 상승 추세에서 구매 신호로 나타납니다. 하향 추세가 형성되면 판매 신호입니다.
세 번째 K선은 내부 K선으로, 즉 종식 가격이 전 K선 범위 내에 있을 때, 최선 신호 포인트이다. 이 때 123 형태가 나타나면 직접 거래 위탁을 할 수 있다.
위탁 가격은 3번째 K선 고점 ((구매) 또는 3번째 K선 저점 ((판매)) 이다. 중지 손실은 2번째 K선 저점 ((구매) 또는 2번째 K선 고점 ((판매)) 이다.
트렌드, 형태, 지표 조건이 충족되면, 브레이크 위탁을 배치하고, 높은 확률로 거래한다. 그리고 수익을 잠금하기 위해 스톱 스톱을 설정하여, 안정적인 브레이크 작업을 수행한다.
우위 분석
이 전략은 다음과 같은 중요한 장점을 가지고 있습니다.
이중 EMA를 사용하여 큰 트렌드 방향을 판단하여 역경 거래를 피하십시오.
K선형은 개척적인 형태를 선별하여 수익률을 높인다.
트렌드, 형태, 가격 차등 지표가 일치할 때만 신호를 발송하여 신호의 질을 보장한다.
내부의 K선 형태는 신호의 신뢰성을 높여 거래 시간을 더욱 고정시킨다.
스톱로스 스톱포인트를 미리 설정하여 개별 거래의 위험을 효과적으로 제어한다.
재검토 데이터 검증, 65% 이상의 승률, 장기적인 수익의 통계적 우위를 가지고 있다.
종합적으로, 이 전략은 트렌드, 형태 및 지표의 종합 판단을 최대한 활용하여 돌파 거래 시점을 정확하게 배치하고, 안정적인 위험-수익 이점을 가지고 있습니다.
위험 분석
이 전략의 주요 위험은 다음과 같습니다.
트렌드 판단 오류, 변동 시 잘못된 신호를 생성한다. 더 많은 트렌드 지표를 도입하여 다차원 확인을 할 수 있다.
단 하나의 중지 중지 방법은 모든 상황에 완벽하게 적합하지 않습니다. 부동 중지 중지 위치 설정이 가능합니다.
K선형 인식은 파라미터 설정에 의존하며, 최적의 조합을 찾기 위해 반복적으로 최적화해야 한다.
갑작스러운 주요 블랙 스윙 사건이 거래에 미치는 영향을 예측할 수 없습니다. 포지션 통제를 적용하여 포지션을 세우는 것이 좋습니다.
재현 데이터는 실제 거래의 성과를 나타낼 수 없으며, 과도한 적합성의 위험이 있습니다. 매개 변수의 건전성을 엄격하게 검증해야합니다.
거래 비용은 높은 주파수 거래 전략에 큰 영향을 미칩니다. 승률과 수익률이 비용을 뒷받침 할 수 있도록 보장해야합니다.
전체적으로, 이 전략은 최적화된 매개 변수 구성을 통해, 더 많은 판단 차원을 도입하고, 포지션 크기를 제어하는 등의 수단을 통해, 위험을 효과적으로 감소시키고, 성과 안정성을 향상시킬 수 있다.
최적화 방향
이 전략에는 다음과 같은 몇 가지 최적화 가능한 차원이 있습니다.
더 많은 K선 주기 변수를 테스트하여 보다 안정적인 변수 조합을 결정한다.
거래량 지표를 늘려서 다차원 확인이 가능하고, 허위 돌파를 방지한다.
샤프율, 수익 손실 비율 등 지표 평가 파라미터의 강도를 높인다.
을 추적하는 메커니즘을 도입하고, 통제 가능한 동적 수익을 실현한다.
VIX 공포 지수와 함께 시장의 불확실성을 피할 수 있습니다.
다양한 포지션 주기 파라미터를 테스트하여 최적의 포지션 시간효율을 결정한다.
정적 정지 손실을 너무 고정하지 않도록 정지 손실 메커니즘을 최적화하십시오.
이러한 수단으로 전략의 안정성, 유연성 및 수익성을 더욱 높일 수 있습니다.
요약하다
정밀 트렌드 뚫기 거래 전략은 트렌드, 형태 및 손실 차단의 유기적 결합을 성공적으로 활용하여 트렌드 뚫림을 포착 할 수있는 높은 확률을 구현합니다. 거래 신호의 명확성, 지표 확인의 다중성, 위험 제어의 특징으로 트렌드 행동에 적합한 효율적인 전략입니다. 지속적인 최적화 및 개선으로,이 전략은 트렌드를 추적하여 포지션 관리를 수행하는 강력한 도구가 될 전망입니다.
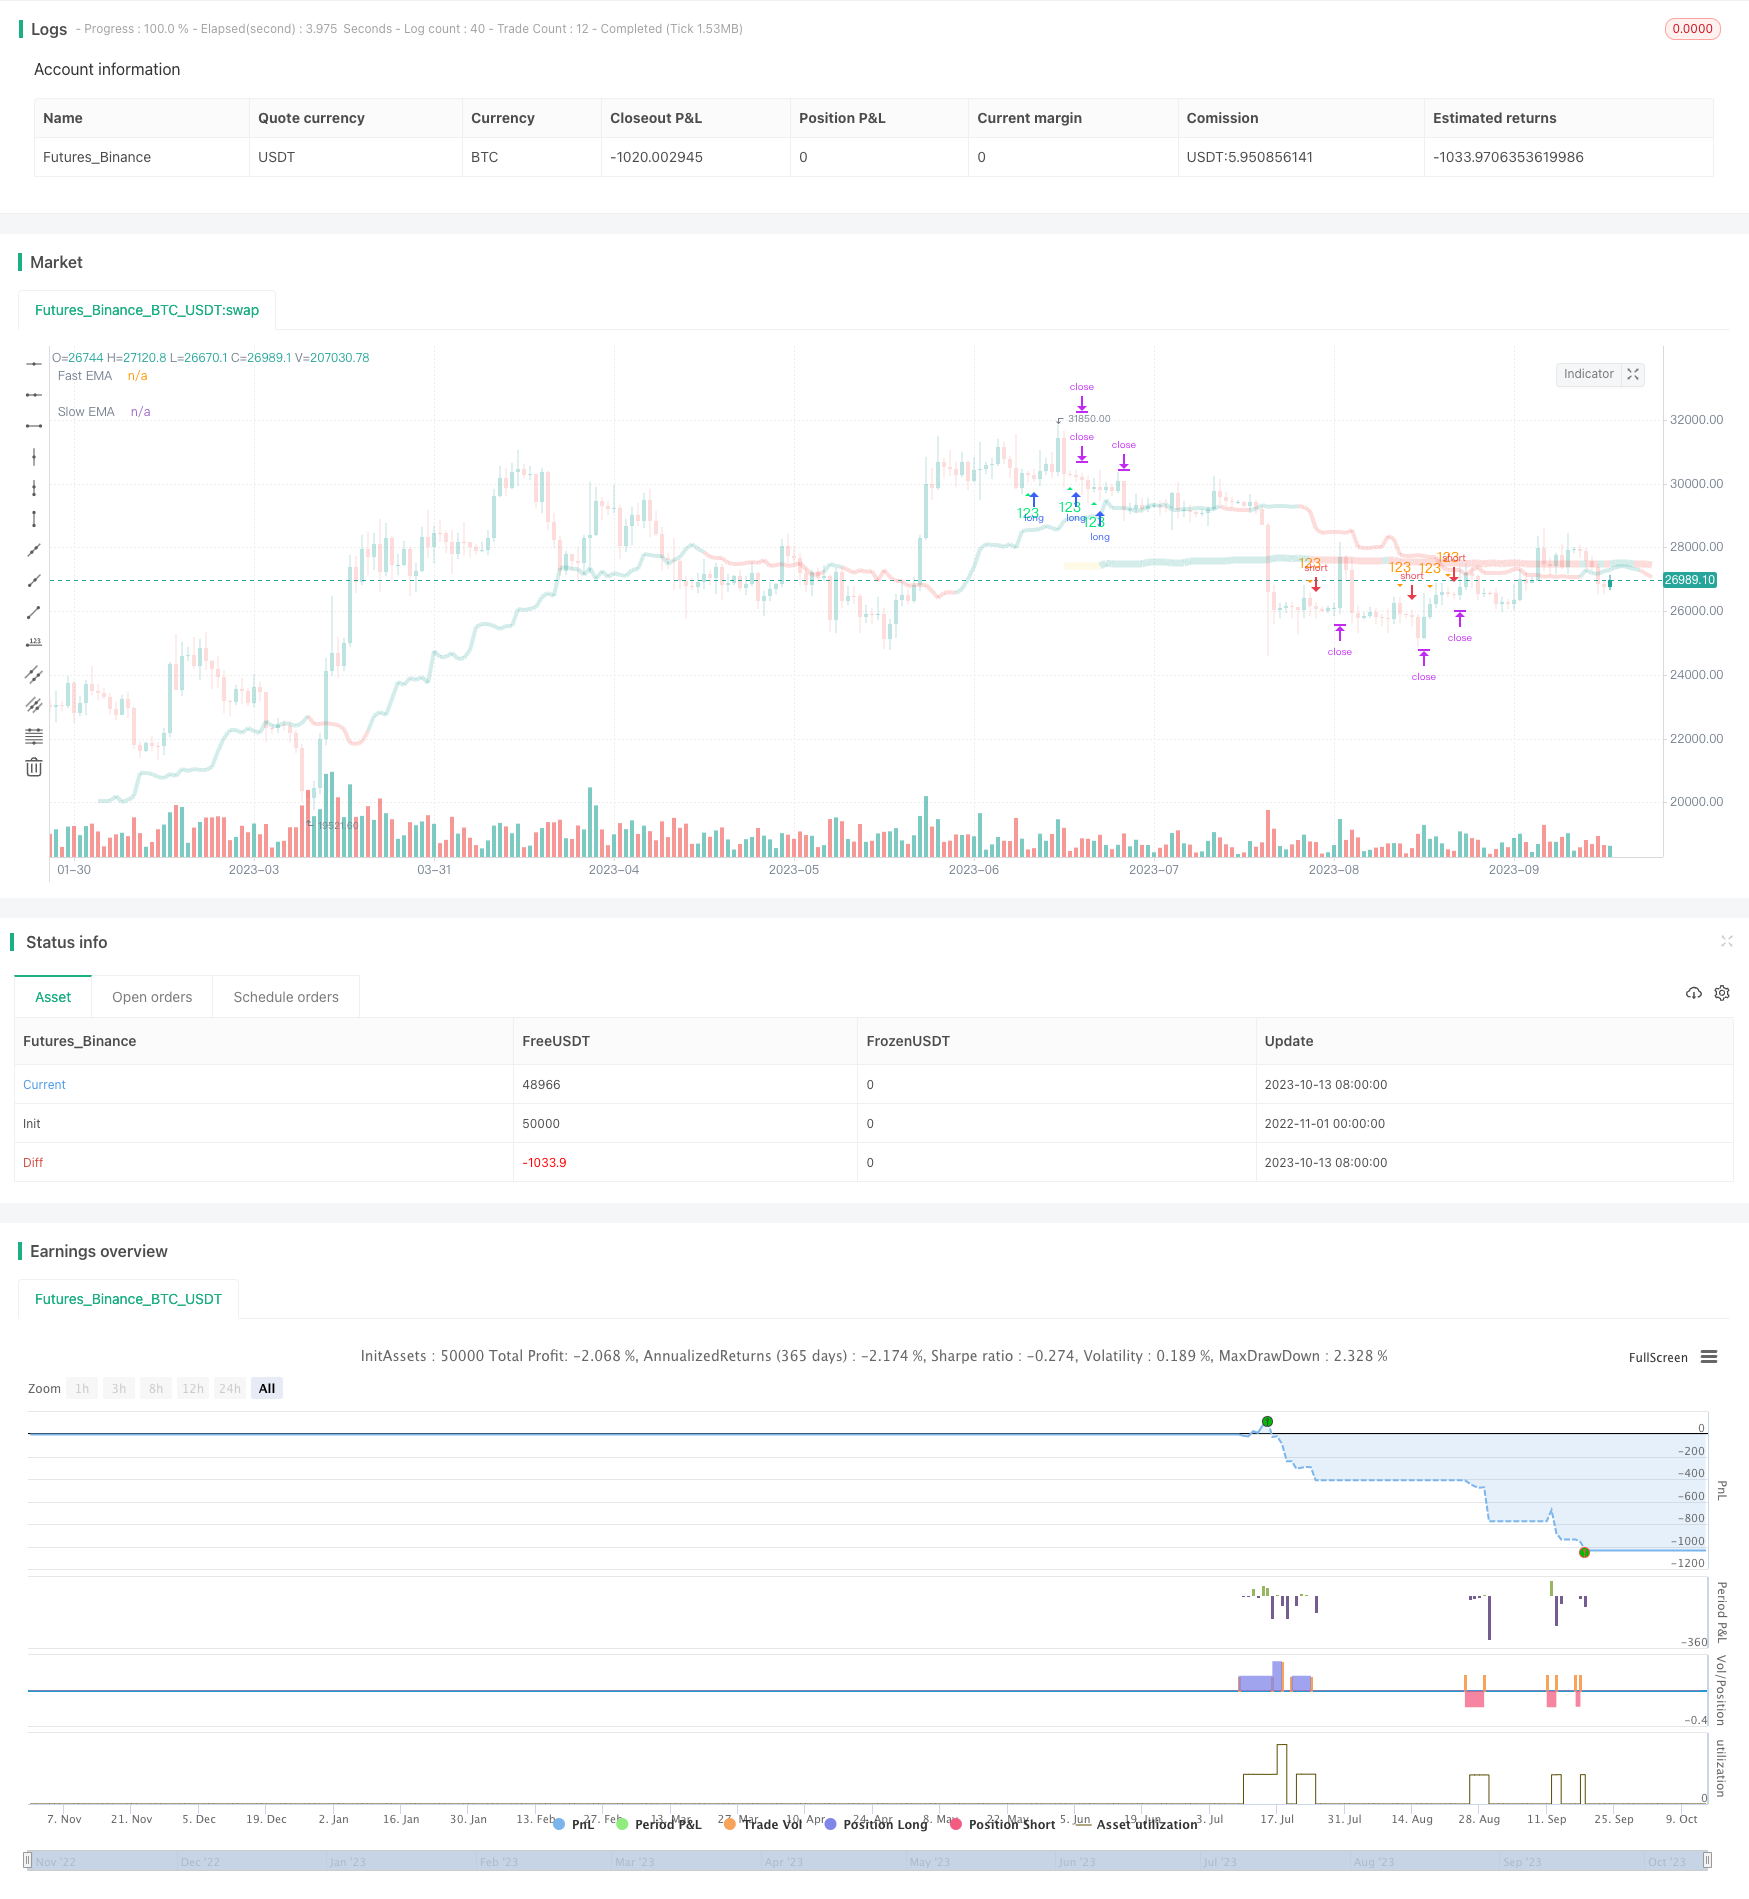
/*backtest
start: 2022-11-01 00:00:00
end: 2023-10-14 05:20:00
period: 1d
basePeriod: 1h
exchanges: [{"eid":"Futures_Binance","currency":"BTC_USDT"}]
*/

// This source code is subject to the terms of the Mozilla Public License 2.0 at https://mozilla.org/MPL/2.0/
// © julianossilva

//@version=5
strategy(title="J2S Backtest: 123-Stormer Strategy",
         shorttitle="J2S Backtest: 123-Stormer Strategy",
         overlay=true, initial_capital=1000, default_qty_value=10,
         default_qty_type = strategy.percent_of_equity, pyramiding=0)

// Initial Backtest Date Range
useStartDate = timestamp("01 Jan 2020 21:00:00")
useEndDate   = timestamp("01 Jan 2023 21:00:00")

// User Inputs
SIGNAL_CONFIG          = "BACKTEST: STORMER STRATEGY (123)"
longEntryInput         = input.bool(defval=true,         title="Long Entry",                     group=SIGNAL_CONFIG)
shortEntryInput        = input.bool(defval=true,         title="Short entry",                    group=SIGNAL_CONFIG)
thresholdForEntryInput = input.int(defval=3,             title="Threshold on clandes for entry", group=SIGNAL_CONFIG)
insideBarStrategyTitle = "Only third candle inside bar is valid"
insideBarStrategyTip   = "According to Stomer, it would be the best signal for the strategy"
insideBarStrategyInput = input.bool(defval=true,         title=insideBarStrategyTitle,           group=SIGNAL_CONFIG, tooltip=insideBarStrategyTip)
EMA_CONFIG             = "BACKTEST: EXPONENTIAL MOVING AVERAGES"
sourceInput            = input.source(defval=close,      title="Source",           inline="01",  group=EMA_CONFIG)
emaTimeframeInput      = input.timeframe("1W",           title="Timeframe",        inline="01",  group=EMA_CONFIG)
emaOffsetInput         = input.int(defval=8,             title="Offset",           inline="01",  group=EMA_CONFIG)
fastEMALengthInput     = input.int(defval=8,             title="Fast EMA Length",  inline="02",  group=EMA_CONFIG)
useFastEMAInput        = input.bool(defval=true,         title="Use Fast EMA",     inline="02",  group=EMA_CONFIG)
slowEMALengthInput     = input.int(defval=80,            title="Slow EMA Length",  inline="03",  group=EMA_CONFIG)
useSlowEMAInput        = input.bool(defval=true,         title="Use Slow EMA",     inline="03",  group=EMA_CONFIG)
PERIOD_CONFIG          = "BACKTEST: TIME PERIOD"
useDateFilterInput     = input.bool(defval=true,         title="Filter Date Range of Backtest",  group=PERIOD_CONFIG)
backtestStartDateInput = input(defval=useStartDate, title="Start Date",                     group=PERIOD_CONFIG)
backtestEndDateInput   = input(defval=useEndDate,   title="End Date",                       group=PERIOD_CONFIG)

// Colors
bbBackgroundColor  = color.rgb(33, 150, 243, 90)
candleColorDown    = color.rgb(239, 83, 80, 80)
candleColorUp      = color.rgb(38, 166, 154, 70)
insideBarColorDown = color.rgb(239, 83, 80, 40)
insideBarColorUp   = color.rgb(38, 166, 154, 20)
downTrendColor     = color.rgb(239, 83, 80, 80)
sidewaysTrendColor = color.rgb(252, 232, 131, 80)
upTrendColor       = color.rgb(38, 166, 154, 80)
buySignalColor     = color.lime
sellSignalColor    = color.orange

// Candles
isCandleUp()   => close > open
isCandleDown() => close <= open
barcolor(isCandleUp() ? candleColorUp : isCandleDown() ? candleColorDown : na)

// Exponential Moving Averages
fastEMA         = request.security(syminfo.tickerid, emaTimeframeInput, ta.ema(sourceInput, fastEMALengthInput),    barmerge.gaps_on,  barmerge.lookahead_on)
currentFastEMA  = request.security(syminfo.tickerid, emaTimeframeInput, ta.ema(sourceInput, fastEMALengthInput),    barmerge.gaps_off, barmerge.lookahead_on)
previousFastEMA = request.security(syminfo.tickerid, emaTimeframeInput, ta.ema(sourceInput[1], fastEMALengthInput), barmerge.gaps_off, barmerge.lookahead_on)
slowEMA         = request.security(syminfo.tickerid, emaTimeframeInput, ta.ema(sourceInput, slowEMALengthInput),    barmerge.gaps_on,  barmerge.lookahead_on)
currentSlowEMA  = request.security(syminfo.tickerid, emaTimeframeInput, ta.ema(sourceInput, slowEMALengthInput),    barmerge.gaps_off, barmerge.lookahead_on)
previousSlowEMA = request.security(syminfo.tickerid, emaTimeframeInput, ta.ema(sourceInput[1], slowEMALengthInput), barmerge.gaps_off, barmerge.lookahead_on)

// Trend Rules for Exponential Moving Averages
isSlowEMAUp()   => currentSlowEMA > previousSlowEMA
isSlowEMADown() => currentSlowEMA < previousSlowEMA
isFastEMAUp()   => currentFastEMA > previousFastEMA
isFastEMADown() => currentFastEMA < previousFastEMA

// Exponential Moving Average Colors
fastEMAColor = isFastEMAUp() ? upTrendColor : isFastEMADown() ? downTrendColor : sidewaysTrendColor
slowEMAColor = isSlowEMAUp() ? upTrendColor : isSlowEMADown() ? downTrendColor : sidewaysTrendColor

// Display Exponential Moving Averages
plot(useFastEMAInput ? fastEMA : na, offset=emaOffsetInput, color=fastEMAColor, title="Fast EMA", style=plot.style_line, linewidth=4)
plot(useSlowEMAInput ? slowEMA : na, offset=emaOffsetInput, color=slowEMAColor, title="Slow EMA", style=plot.style_line, linewidth=7)

// Price Trend
pricesAboveFastEMA() => low[2] > currentFastEMA and low[1] > currentFastEMA and low > currentFastEMA
pricesAboveSlowEMA() => low[2] > currentSlowEMA and low[1] > currentSlowEMA and low > currentSlowEMA
pricesBelowFastEMA() => high[2] < currentFastEMA and high[1] < currentFastEMA and high < currentFastEMA
pricesBelowSlowEMA() => high[2] < currentSlowEMA and high[1] < currentSlowEMA and high < currentSlowEMA

// Market in Bullish Trend
isBullishTrend() =>
    if useFastEMAInput and useSlowEMAInput
        pricesAboveFastEMA() and pricesAboveSlowEMA()
    else if useFastEMAInput
        pricesAboveFastEMA()
    else if useSlowEMAInput
        pricesAboveSlowEMA()
    else
        na

// Market in Bearish Trend
isBearishTrend() =>
    if useFastEMAInput and useSlowEMAInput
        pricesBelowFastEMA() and pricesBelowSlowEMA()
    else if useFastEMAInput
        pricesBelowFastEMA()
    else if useSlowEMAInput
        pricesBelowSlowEMA()
    else
        na

// Stormer Strategy (123)
isFirstCandleUp()   => high[2] > high[1] and low[2] > low[1]
isFirstCandleDown() => high[2] < high[1] and low[2] < low[1]
isThirdCandleUp()   => low > low[1]
isThirdCandleDown() => high < high[1]
isThirdCandleInsideBar() => high < high[1] and low > low[1]

// Buy Signal
isStormer123Buy() =>
    if insideBarStrategyInput
        longEntryInput and isFirstCandleUp() and isThirdCandleInsideBar() and isBullishTrend()
    else
        longEntryInput and isFirstCandleUp() and isThirdCandleUp() and isBullishTrend()

// Sell Signal
isStormer123Sell() =>
    if insideBarStrategyInput
        shortEntryInput and isFirstCandleDown() and isThirdCandleInsideBar() and isBearishTrend()
    else
        shortEntryInput and isFirstCandleDown() and isThirdCandleDown() and isBearishTrend()

// Backtest Time Period
inTradeWindow             = true
isInTradeWindow()         => inTradeWindow
isBacktestDateRangeOver() => not inTradeWindow and inTradeWindow[1]

// Backtest Price Parameters
highestPrice = ta.highest(high, 3)
lowestPrice  = ta.lowest(low,3)
priceRange   = highestPrice - lowestPrice

// Stormer Strategy (123): LONG
var myLongOrders = array.new_int(0)
longtEntryID     = "Long Entry:\n" + str.tostring(bar_index)
longExitID       = "Long Exit:\n" + str.tostring(bar_index)
stopLossInLong   = lowestPrice + 0.01
takeProfitInLong = priceRange + high

longEntryHasBeenMet = isInTradeWindow() and isBullishTrend() and isStormer123Buy()

// Scheduling LONG entry
if longEntryHasBeenMet
    array.push(myLongOrders, bar_index)
    strategy.order(longtEntryID, strategy.long, stop=high)
    strategy.exit(longExitID, longtEntryID, stop=stopLossInLong, limit=takeProfitInLong)

// In pine script, any order scheduled but not yet filled can be canceled.
// Once a order is filled, the trade is only finished with use of close or exit functions.
// As scheduled orders are not stored in the strategy.opentrades array, manual control is required.
for myOrderIndex = 0 to (array.size(myLongOrders) == 0 ? na : array.size(myLongOrders) - 1)
    myLongOrder = array.get(myLongOrders, myOrderIndex)
    if bar_index - myLongOrder == thresholdForEntryInput
        longEntryID = "Long Entry:\n" + str.tostring(myLongOrder)
        strategy.cancel(longEntryID)

// Stormer Strategy (123): SHORT
var myShortOrders = array.new_int(0)
shortEntryID      = "Short Entry:\n" + str.tostring(bar_index)
shortExitID       = "Short Exit:\n" + str.tostring(bar_index)
stopLossInShort   = highestPrice + 0.01
takeProfitInShort = low - priceRange

shortEntryHasBeenMet = isInTradeWindow() and isBearishTrend() and isStormer123Sell()

// Scheduling SHORT entry
if shortEntryHasBeenMet
    array.push(myShortOrders, bar_index)
    strategy.order(shortEntryID, strategy.short, stop=low)
    strategy.exit(shortExitID, shortEntryID, stop=stopLossInShort, limit=takeProfitInShort)

// In pine script, any order scheduled but not yet filled can be canceled.
// Once a order is filled, the trade is only finished with use of close or exit functions.
// As scheduled orders are not stored in the strategy.opentrades array, manual control is required.
for myOrderIndex = 0 to (array.size(myShortOrders) == 0 ? na : array.size(myShortOrders) - 1)
    myShortOrder = array.get(myShortOrders, myOrderIndex)
    if bar_index - myShortOrder == thresholdForEntryInput
        shortEntryID := "Short Entry:\n" + str.tostring(myShortOrder)
        strategy.cancel(shortEntryID)

// Close all positions at the end of the backtest period
if isBacktestDateRangeOver()
    strategy.cancel_all()
    strategy.close_all(comment="Date Range Exit")

// Display Signals
plotshape(series=longEntryHasBeenMet,  title="123 Buy",  style=shape.triangleup,   location=location.belowbar, color=buySignalColor,  text="123", textcolor=buySignalColor)
plotshape(series=shortEntryHasBeenMet, title="123 Sell", style=shape.triangledown, location=location.abovebar, color=sellSignalColor, text="123", textcolor=sellSignalColor)