추세 추종 반전 및 엘러스 선행 지표 조합 전략

개요
이 전략은 트렌드 추적 반전 전략과 엘레스 선도 지표 전략의 조합으로, 더 신뢰할 수 있는 거래 신호를 얻기 위한 것이다. 트렌드 추적 반전 전략은 트렌드 반전 포인트를 판단하고, 엘레스 선도 지표 전략은 주기적 전환 포인트를 판단한다. 조합 신호는 시장 진입 시기를 더 정확하게 판단한다.
전략 원칙
추세 추종 반전 전략
이 전략은 울프 <unk>센의 책 How I Triple My Money in the Futures Market, 183쪽에서 유래했다. 이 전략은 역전형 전략에 속한다. 종식 가격이 2일 연속으로 전날의 종식 가격보다 높고, 9일 스토카스틱 슬로 라인이 50보다 낮으면 더 많이 한다. 종식 가격이 2일 연속으로 전날의 종식 가격보다 낮고, 9일 스토카스틱 스로 라인이 50보다 높으면 공백한다.
엘러스의 선도적 지표 전략
이 전략은 일일 데이터를 사용하여 일일 상향 동향 합성 가격 (Detrended Synthetic Price, DSP) 과 일일 엘러스 선도 지표 (Ehlers Leading Indicator, ELI) 를 도식화한다. DSP는 가격 지배 주기 (price dominance cycle) 를 포착할 수 있으며, 계산 방법은 2단 바트워스 스<unk> 파동 (two-step Watts Swing) 이내 3단 스<unk> 파동 (three-step Swing) 이다.
우위 분석
이 조합 전략의 가장 큰 장점은 트렌드 반전 판단과 주기적 반전 판단을 결합하여 거래 신호가 더 신뢰할 수 있다는 것입니다. 트렌드 반전 전략은 상승 하향 경로를 돌파하는 트렌드 반전점을 판단 할 수 있습니다. 엘레스 선도 지표는 주기적 낮은 곳과 높은 곳을 미리 알려줍니다. 둘을 결합하면 시장 진입 시기를 더 정확하게 잡을 수 있습니다.
또 다른 장점은 매개 변수 조정의 유연성이다. 트렌드 리버스 전략의 주식 지표 매개 변수는 시장에 따라 조정할 수 있다. 엘레스 선도 지표의 주기 길이는 또한 다른 주기에 적응할 수 있다.
위험 분석
이 전략의 가장 큰 위험은 트렌드를 놓치는 것입니다. 반전 신호가 나타나기를 기다리는 전략이 출장하기 때문에, 초기 강한 트렌드 단계를 놓칠 수 있습니다. 또한, 반전 신호는 가짜 돌파구가 될 수 있으며, 틀어질 수도 있습니다.
해결 방법은 변수를 조정하고, 반전 판단주기를 단축하고, 트렌드 반전을 적시에 포착하는 것이다. 또한 손실을 통제하기 위해 스톱로스를 도입할 수도 있다.
최적화 방향
이 전략은 다음과 같은 부분에서 최적화될 수 있습니다.
-
단편적 손실을 통제하기 위해 Stop Loss 전략을 도입하십시오.
-
최적화 매개 변수, 회전 신호 주기를 조정하여 다른 시장 환경에 적응한다.
-
다른 지표 필터링을 추가하여 신호 품질을 향상시키고 가짜 신호를 줄여줍니다.
-
전체 포지션과 위험을 제어하기 위해 자금 관리 모듈을 추가합니다.
-
다양한 품종의 매개 변수의 효과를 테스트하고, 어떤 품종에 적합한지를 최적화한다.
-
기계 학습 모듈을 추가하여 파라미터를 조정할 수 있도록 조정할 수 있습니다.
요약하다
이 전략은 트렌드 반전 판단과 주기적 전환 판단을 결합하여 시장 진입 시기를 보다 안정적으로 잡을 수 있다. 가장 큰 장점은 신호 품질이 좋고 조정성이 강하다. 가장 큰 위험은 초기 트렌드를 놓치는 것으로, 파라미터 조정, 스톱으로 제어할 수 있다. 향후 스톱, 파라미터 최적화, 신호 필터 등에서 개선할 수 있어 전략이 다른 시장 환경에 더 잘 적응할 수 있다.
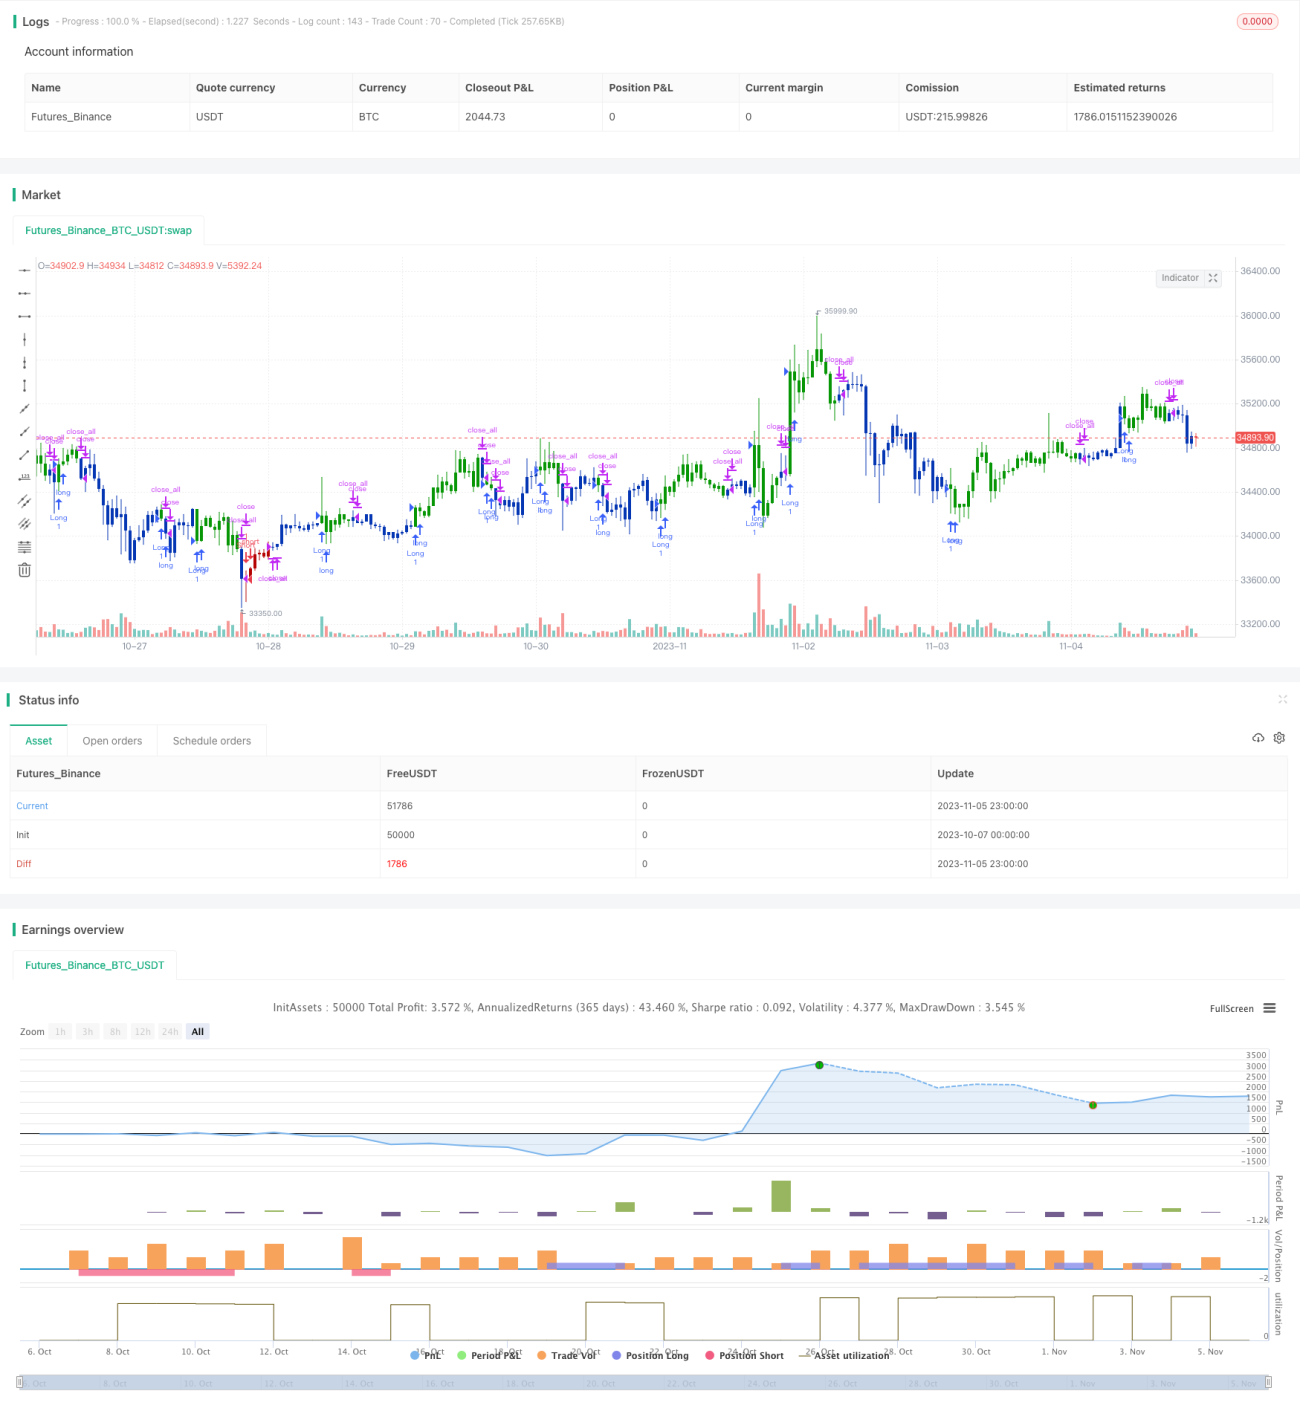
/*backtest
start: 2023-10-07 00:00:00
end: 2023-11-06 00:00:00
period: 1h
basePeriod: 15m
exchanges: [{"eid":"Futures_Binance","currency":"BTC_USDT"}]
*/

//@version=4
////////////////////////////////////////////////////////////
//  Copyright by HPotter v1.0 26/11/2019
// This is combo strategies for get a cumulative signal. - 1