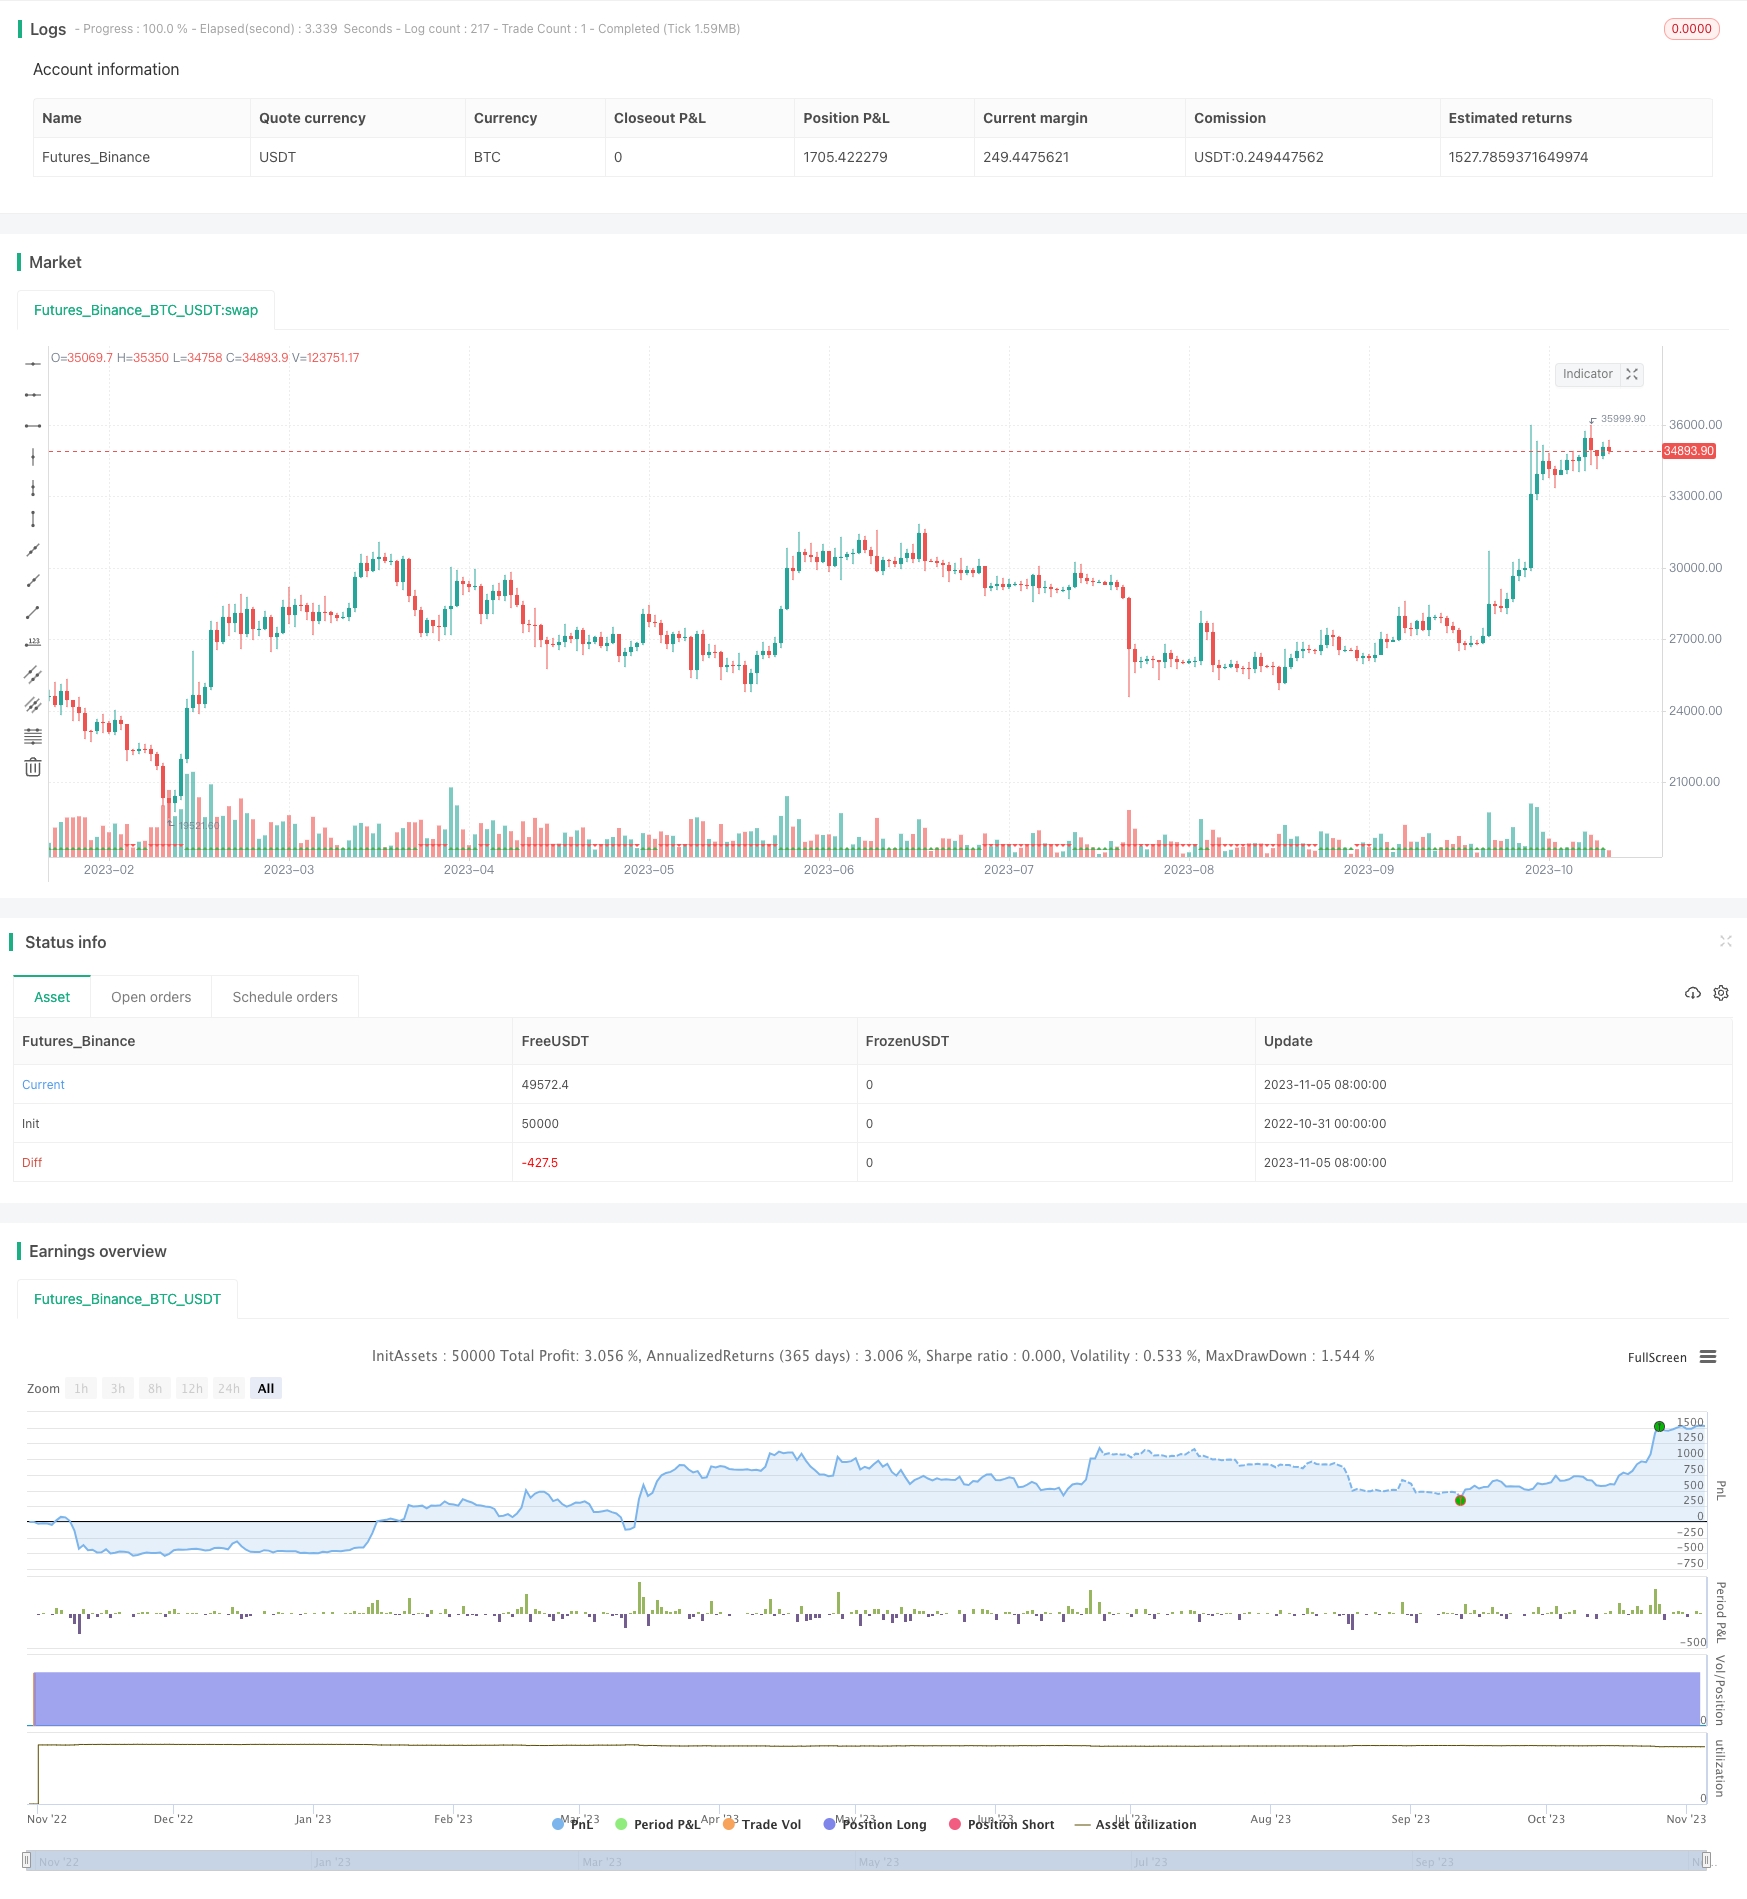
개요
이 전략은 평균 트렌드 지표 DI+와 DI-를 기반으로 두 개의 다른 시간 프레임의 DI 지표를 사용하여 트렌드 방향을 판단하고, 더 많은 공백을 한다. 더 큰 시간 프레임과 더 작은 시간 프레임의 DI+가 DI-보다 높을 때 낙관적 경향으로 판단하고, 더 많은 공백을 한다. 두 시간 프레임의 DI-가 DI+보다 높을 때, 하향 경향으로 판단하고, 공백을 한다.
원칙
이 전략은 다음과 같은 몇 가지 원칙에 기초하고 있습니다.
DI+와 DI-을 계산한다. 높은 가격, 닫기 가격, 낮은 가격을 얻어 DI+와 DI-을 계산한다.
두 시간 프레임의 DI+와 DI-을 비교한다. DI+와 DI-는 각각 메인 그래프의 시간 프레임 (예: 1시간) 과 더 큰 시간 프레임 (예: 일대선) 에서 계산되며, 크기와 크기의 관계가 비교된다.
트렌드 방향을 판단한다. 더 큰 시간 프레임의 DI+와 더 작은 시간 프레임의 DI-가 모두 DI-보다 크면 다목적 트렌드로 판단한다. 두 시간 프레임의 DI-가 모두 DI+보다 크면 공허 트렌드로 판단한다.
거래 신호를 발산한다. 다중 헤드 신호는 두 시간 프레임 DI+>DI-, 더 많은 것을 한다. 빈 헤드 신호는 두 시간 프레임 DI->DI+, 빈 것을 한다.
스톱을 설정한다. ATR을 기반으로 스톱을 계산하고, 트렌드 추적 스톱을 구현한다.
탈퇴 조건: 손실이 발생하거나 가격이 역전될 때 청산한다.
우위 분석
이 전략은 다음과 같은 장점을 가지고 있습니다.
이중 시간 프레임 DI를 사용하여 트렌드를 판단하여 일부 가짜 돌파구를 필터링 할 수 있습니다.
ATR은 동적 트래킹으로 스톱로스를 추적하여 수익을 최대한 보호하고 너무 작은 스톱로스를 방지합니다.
시간적 손실은 단편적 손실을 통제할 수 있습니다.
트렌드 트레이딩을 통해 트렌드 기회를 잡을 수 있습니다.
규칙은 명확하고 이해하기 쉽고, 실내에서 사용하기 편리하다.
위험과 해결책
이 전략에는 다음과 같은 위험도 있습니다.
DI 지표가 지연되어 있고, 출전 시간을 놓칠 수 있다. 적절한 최적화 파라미터를 사용하거나, 다른 지표와 결합하여 판단할 수 있다.
이중 시간 프레임 판단에는 상하의 차이가 있을 수 있다. 시간 프레임 검증 신호를 추가할 수 있다.
너무 급진적인 스톱로스는 너무 자주 거래할 수 있다. ATR 배수를 적절히 완화할 수 있다.
불안정한 상황에서는 거래 빈도가 증가할 수 있다. 필터링 조건을 추가함으로써 거래 빈도를 줄일 수 있다.
매개 변수 최적화는 역사 데이터에 의존하며, 실 디스크에는 과도한 최적화가 존재할 수 있다. 매개 변수 무지성을 신중하게 평가해야 한다.
최적화 방향
이 전략은 다음과 같은 측면에서 최적화될 수 있습니다.
DI 계산 변수를 최적화하여 최적의 변수 조합을 찾습니다.
다른 지표 필터를 추가하여 신호 정확도를 향상시킵니다. MACD, KDJ 등.
더 많은 시장 조건에 적응하기 위해 손실을 막는 전략을 최적화하십시오. 이동 손실 또는 상장 손실로 변경 할 수 있습니다.
트레이딩 시간 필터를 추가하여 중요한 뉴스 이벤트를 피하십시오.
다양한 품종의 파라미터를 테스트하고 적응력을 높인다.
기계학습 요소를 추가하고, 역사적인 데이터를 사용하여 판단 모델을 훈련합니다.
요약하다
이 전략은 전체적으로 전형적인 트렌드 추적 전략으로, DI 지표를 사용하여 트렌드 방향을 판단하고, 스톱로스를 설정하여 수익을 고정하고, 트렌드에서 수익을 지속한다. 이 전략의 장점은 전략 아이디어가 명확하고 실내에서 작동하기 쉽다는 것이다. 또한 최적화 매개 변수, 필터 조건을 추가하는 등의 개선의 여지가 있다. 테스트를 계속 최적화하면 이 전략은 매우 실용적인 트렌드 추적 전략이 될 수 있다.
/*backtest
start: 2022-10-31 00:00:00
end: 2023-11-06 00:00:00
period: 1d
basePeriod: 1h
exchanges: [{"eid":"Futures_Binance","currency":"BTC_USDT"}]
*/

// This source code is subject to the terms of the Mozilla Public License 2.0 at https://mozilla.org/MPL/2.0/
// © DojiEmoji

//@version=5
strategy("DI+/- multi TF Strat [KL]", overlay=true, pyramiding=1, initial_capital=1000000000, default_qty_type=strategy.percent_of_equity, default_qty_value=5)
var string GROUP_ALERT    = "Alerts"
var string GROUP_SL       = "Stop loss"
var string GROUP_ORDER    = "Order size"
var string GROUP_TP       = "Profit taking"
var string GROUP_HORIZON  = "Time horizon of backtests"
var string GROUP_IND      = "Directional IndicatorDI+ DI-"

// ADX Indicator {
adx_len = input(14, group=GROUP_IND, tooltip="Typically 14")
tf1 = input.timeframe("", title="DI +/- in Timeframe 1", group=GROUP_IND, tooltip="Main: DI+ > DI-")
tf2 = input.timeframe("1D", title="DI +/- in Timeframe 2", group=GROUP_IND, tooltip="Confirmation: DI+ > DI-")
// adx_thres = input(20, group=GROUP_IND)   //threshold not used in this strategy

get_ADX(_high, _close, _low) =>
// (high, close, mid) -> [plus_DM, minus_DM]
    // Based on TradingView user BeikabuOyaji's implementation
    _tr = math.max(math.max(_high - _low, math.abs(_high - nz(_close[1]))), math.abs(_low - nz(_close[1])))
    smooth_tr = 0.0
    smooth_tr := nz(smooth_tr[1]) - nz(smooth_tr[1]) / adx_len + _tr

    smooth_directional_mov_plus = 0.0
    smooth_directional_mov_plus := nz(smooth_directional_mov_plus[1]) - nz(smooth_directional_mov_plus[1]) / adx_len + (_high - nz(_high[1]) > nz(_low[1]) - _low ? math.max(_high - nz(_high[1]), 0) : 0)

    smooth_directional_mov_minus = 0.0
    smooth_directional_mov_minus := nz(smooth_directional_mov_minus[1]) - nz(smooth_directional_mov_minus[1]) / adx_len + (nz(_low[1]) - _low > _high - nz(_high[1]) ? math.max(nz(_low[1]) - _low, 0) : 0)

    plus_DM = smooth_directional_mov_plus / smooth_tr * 100
    minus_DM = smooth_directional_mov_minus / smooth_tr * 100
    // DX = math.abs(plus_DM - minus_DM) / (plus_DM + minus_DM) * 100   // DX not used in this strategy
    [plus_DM, minus_DM]

// DI +/- from timeframes 1 and 2
[plus_DM_tf1, minus_DM_tf1] = get_ADX(request.security(syminfo.tickerid, tf1, high), request.security(syminfo.tickerid, tf1, close),request.security(syminfo.tickerid, tf1, low))
[plus_DM_tf2, minus_DM_tf2] = get_ADX(request.security(syminfo.tickerid, tf2, high),request.security(syminfo.tickerid, tf2, close),request.security(syminfo.tickerid, tf2, low))
// } end of block: ADX Indicator


var string ENUM_LONG      = "LONG"
var string LONG_MSG_ENTER = input.string("Long entered", title="Alert MSG for buying (Long position)", group=GROUP_ALERT)
var string LONG_MSG_EXIT  = input.string("Long closed", title="Alert MSG for closing (Long position)", group=GROUP_ALERT)
backtest_timeframe_start = input(defval=timestamp("01 Apr 2020 13:30 +0000"), title="Backtest Start Time", group=GROUP_HORIZON)
within_timeframe         = true

// Signals for entry
_uptrend_confirmed = plus_DM_tf1 > minus_DM_tf1 and plus_DM_tf2 > minus_DM_tf2
entry_signal_long = _uptrend_confirmed

plotshape(_uptrend_confirmed, style=shape.triangleup, location=location.bottom, color=color.green)
plotshape(not _uptrend_confirmed, style=shape.triangledown, location=location.bottom, color=color.red)

// Trailing stop loss ("TSL") {
tsl_multi                 = input.float(2.0, title="ATR Multiplier for trailing stoploss", group=GROUP_SL)
SL_buffer                 = ta.atr(input.int(14, title="Length of ATR for trailing stoploss", group=GROUP_SL)) * tsl_multi
TSL_source_long           = low
var stop_loss_price_long  = float(0)
var pos_opened_long       = false

stop_loss_price_long := pos_opened_long ? math.max(stop_loss_price_long, TSL_source_long - SL_buffer) : TSL_source_long - SL_buffer

// MAIN: {
if pos_opened_long and TSL_source_long <= stop_loss_price_long
    pos_opened_long := false
    alert(LONG_MSG_EXIT, alert.freq_once_per_bar)
    strategy.close(ENUM_LONG, comment=close < strategy.position_avg_price ? "stop loss" : "take profit")

// (2) Update the stoploss to latest trailing amt.
if pos_opened_long
    strategy.exit(ENUM_LONG, stop=stop_loss_price_long, comment="SL")

// (3) INITIAL ENTRY:
if within_timeframe and entry_signal_long
    pos_opened_long := true
    alert(LONG_MSG_ENTER, alert.freq_once_per_bar)
    strategy.entry(ENUM_LONG, strategy.long, comment="long")

// Plotting:
TSL_transp_long = pos_opened_long and within_timeframe ? 0 : 100
plot(stop_loss_price_long, color=color.new(color.green, TSL_transp_long))

// CLEAN UP: Setting variables back to default values once no longer in use
if ta.change(strategy.position_size) and strategy.position_size == 0
    pos_opened_long := false

if not pos_opened_long
    stop_loss_price_long := float(0)

// } end of MAIN block