SMA 기반 롱-숏 전략

개요
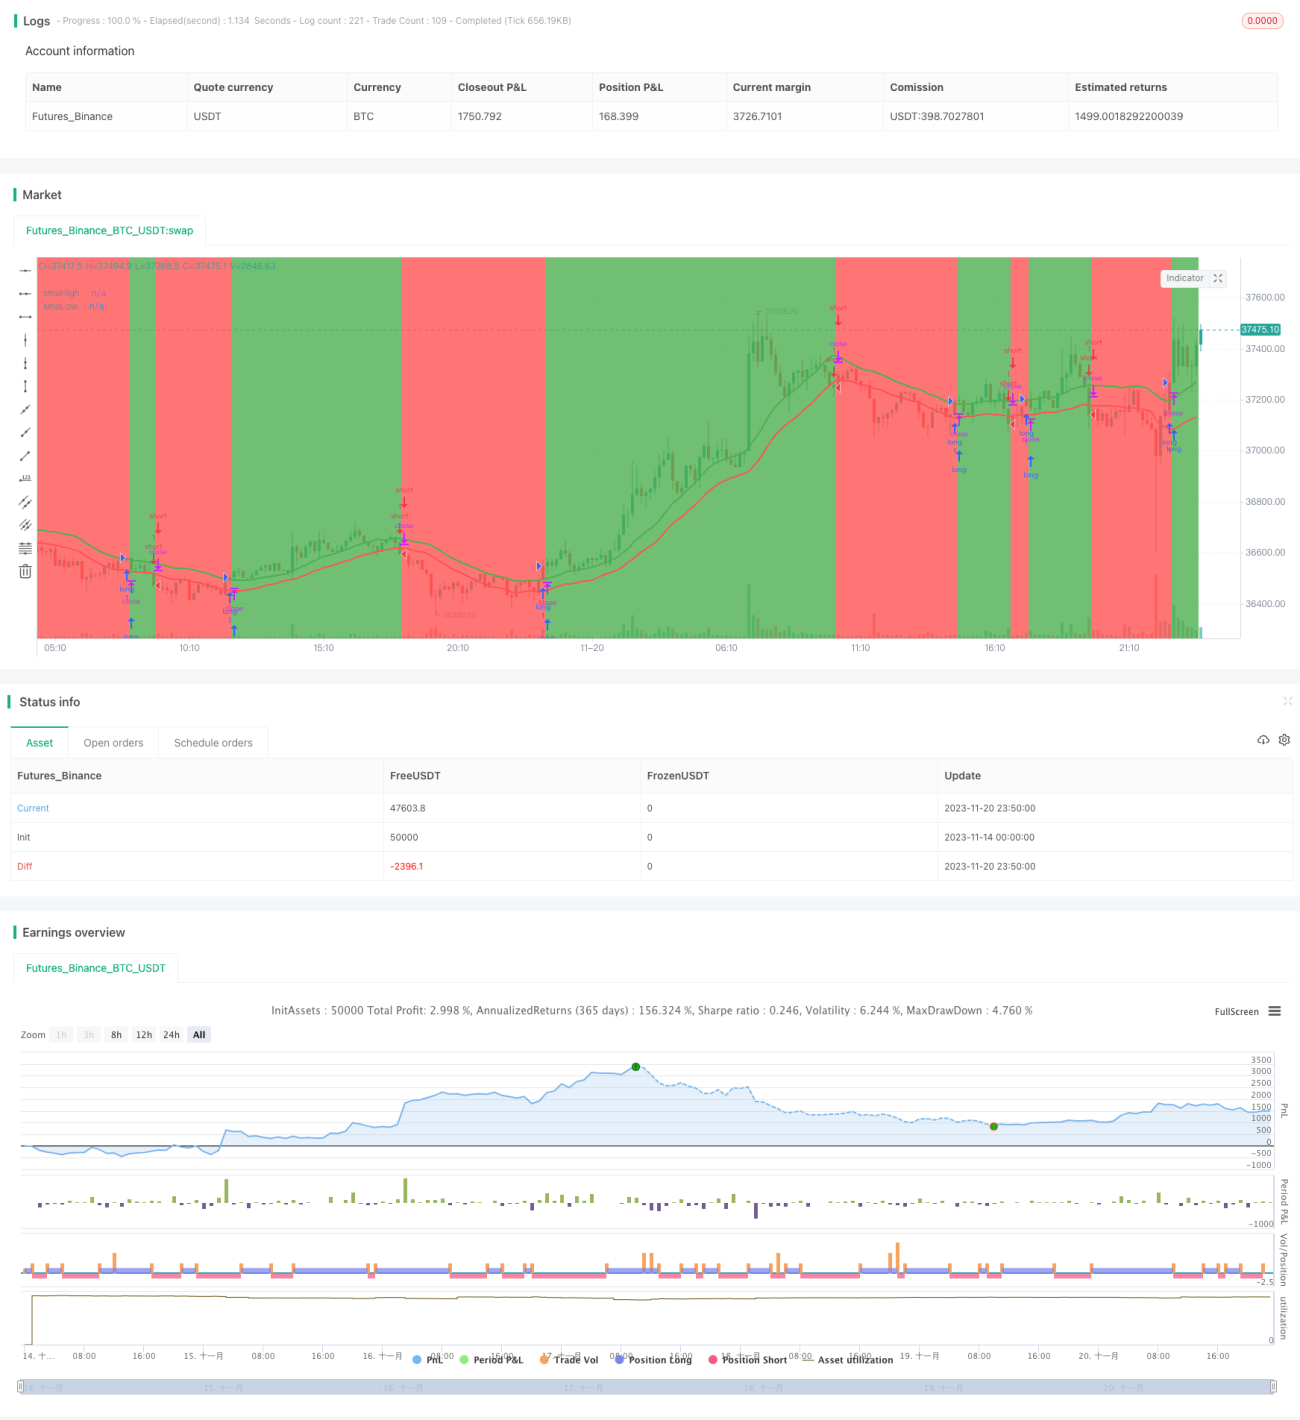
이 전략은 SMA 지표에 기반한 간단한 다공간 전략을 구축한다. 가격이 20주기 높은 SMA를 넘으면 더 많은 것을 하고, 가격이 20주기 낮은 SMA를 넘으면 더 많은 것을 하지 않는다. 동시에 손실 퇴출 메커니즘을 설정한다.
전략 원칙
이 전략은 20주기의 가장 높은 가격과 가장 낮은 가격의 SMA를 다채로운 지표로 사용합니다. 가격이 가장 높은 SMA를 통과했을 때, 현재 상승 추세에 있다고 생각하면 더 많은 돈을 벌 수 있습니다. 가격이 가장 낮은 SMA를 넘어서는 경우 현재 하향 추세에 있다고 생각하면 더 많은 돈을 벌 수 있습니다.
구체적으로, 전략은 20주기highest 최고 가격과lowest 최저 가격의 SMA를 먼저 계산하고, 지표선을 그립니다. 그리고 다음 거래 논리를 설정합니다:
다중 입점: 상위 SMA를 통과한 경우
다수 출전: 마감 가격 0.99배highest SMA 아래로
공짜로 입시: 폐막 가격 아래로 LOWEST SMA를 돌파할 때
공짜 출장: 1.01배로 LOWEST SMA를 마감할 때
이런 식으로 트렌드를 따라가는 다공간 전략이 만들어집니다.
우위 분석
이 전략은 다음과 같은 장점이 있습니다.
- SMA 지표를 사용하여 트렌드 방향을 판단하는 것은 간단하고 실용적입니다.
2. HIGHEST SMA와 LOWEST SMA는 지표의 중요한 역할을 수행하여 저항선을 지원합니다.
3. 손해 방지 설계는 합리적이고, 막대한 손실을 최대한 방지합니다.
4. 다재다능하고, 다양한 시간대와 품종을 사용할 수 있습니다.
위험 분석
이 전략에는 위험도 있습니다.
- SMA 지표가 지연되어 트렌드 전환점을 놓칠 수 있다
- 시장의 비상사태에 대한 예방 조치
- 거래 비용의 영향을 고려하지 않습니다.
다른 지표와 결합하여 이러한 위험을 제어하고 줄일 수 있습니다.
최적화 방향
이 전략은 다음과 같은 부분에서 최적화될 수 있습니다.
- MACD, KDJ 등과 같은 다른 지표의 추세 판단과 함께
- 추가된 비상사태 방안 장치, 예를 들어 정지, 가격 제한 등과 같은 비정상적인 상황 처리
- 최적화 SMA 주기 변수, 최적의 변수 조합을 찾아
- 다른 종과 다른 기간에 대한 최적의 변수를 고려합니다.
- 거래비용의 영향을 평가하고 최적의 스톱로스 및 스톱포스트를 설정합니다.
요약하다
이 전략의 전체적인 아이디어는 명확하고, 구현하기 쉽다. SMA 지표를 통해 공허 경향을 판단하고, 합리적인 진입 및 퇴출 메커니즘을 설정하면 좋은 효과를 얻을 수 있다. 추가적인 최적화 공간이 있으며, 다른 지표와 기법과 함께하면, 장기적으로 추적할 가치가 있는 좋은 잠재력을 가진 전략이 될 수 있다.
- 1