빠른 이동평균선과 느린 이동평균선의 교차전략을 기반으로 함

1
Follow
1778
Followers
개요
이동 평균 가로 전략은 이동 평균을 기반으로 한 간단하고 효과적인 양적 거래 전략이다. 이 전략은 빠른 이동 평균과 느린 이동 평균의 교차를 구매 및 판매 신호로 사용합니다. 빠른 선이 아래쪽에서 느린 선을 뚫을 때 구매 신호를 생성하고 빠른 선이 위쪽에서 아래쪽에서 느린 선을 뚫을 때 판매 신호를 생성합니다.
전략 원칙
이 전략의 핵심 논리는 이동 평균을 사용하여 시장의 추세를 판단하는 것이다. 이동 평균은 그 자체로 주파수 무작위 시장 소음의 기능을 가지고 있다. 빠른 이동 평균은 최신 추세를 반영하여 가격 변화에 더 빠르게 반응하며, 느린 이동 평균은 최신 가격 변화에 더 느리게 반응하여 중장기적 추세를 나타냅니다.
구체적으로, 이 전략은 먼저 빠른 이동 평균 sign1과 느린 이동 평균 sign2를 정의한다. 그리고는 sig1과 sig2의 교차 관계에 따라 매매점을 판단한다. sign1이 아래에서 sign2을 돌파할 때 구매 신호를 생성한다. longCondition; sign1이 위로부터 아래로 내려가 sign2을 돌파할 때 판매 신호를 생성한다.
우위 분석
이 전략의 장점은 분명합니다.
- 논리적으로 간단하고, 이해하기 쉽고, 구현하기 쉽습니다.
- 매개 변수 조정 유연성, 시장 조건에 따라 조정 가능
- 다른 지표의 필터 신호와 결합하여 안정성을 높일 수 있습니다.
- 좋은 성과, 예를 들어 EMA15-EMA30 조합은 EURCHF 일선 데이터에서 83%의 승률을 나타냅니다.
위험 분석
이 전략에는 위험도 있습니다.
- 위프사우 효과는 심각한데, 손해 방지 설정이 중요합니다.
- "대시장 흔들림은 효과가 없다"
- 다양한 품종과 주기에 적응하기 위해 반복적으로 조율 테스트가 필요합니다.
최적화 조치:
- 다른 지표들을 추가하고, whipsaw를 피하십시오.
- 이동 평균 유형과 변수를 다른 품종에 맞게 조정합니다.
- 제약금지 비율을 최적화하고 위험을 통제합니다.
요약하다
이동 평균 가로 전략은 전체적으로 논리적으로 간단하고 실용적인 양적 전략이다. 매개 변수 조정과 적절한 최적화를 통해 다양한 시장 환경에서 안정적인 수익을 낼 수 있다. 양적 거래자가 집중 연구하고 적용할 가치가 있다.
Source
Pine
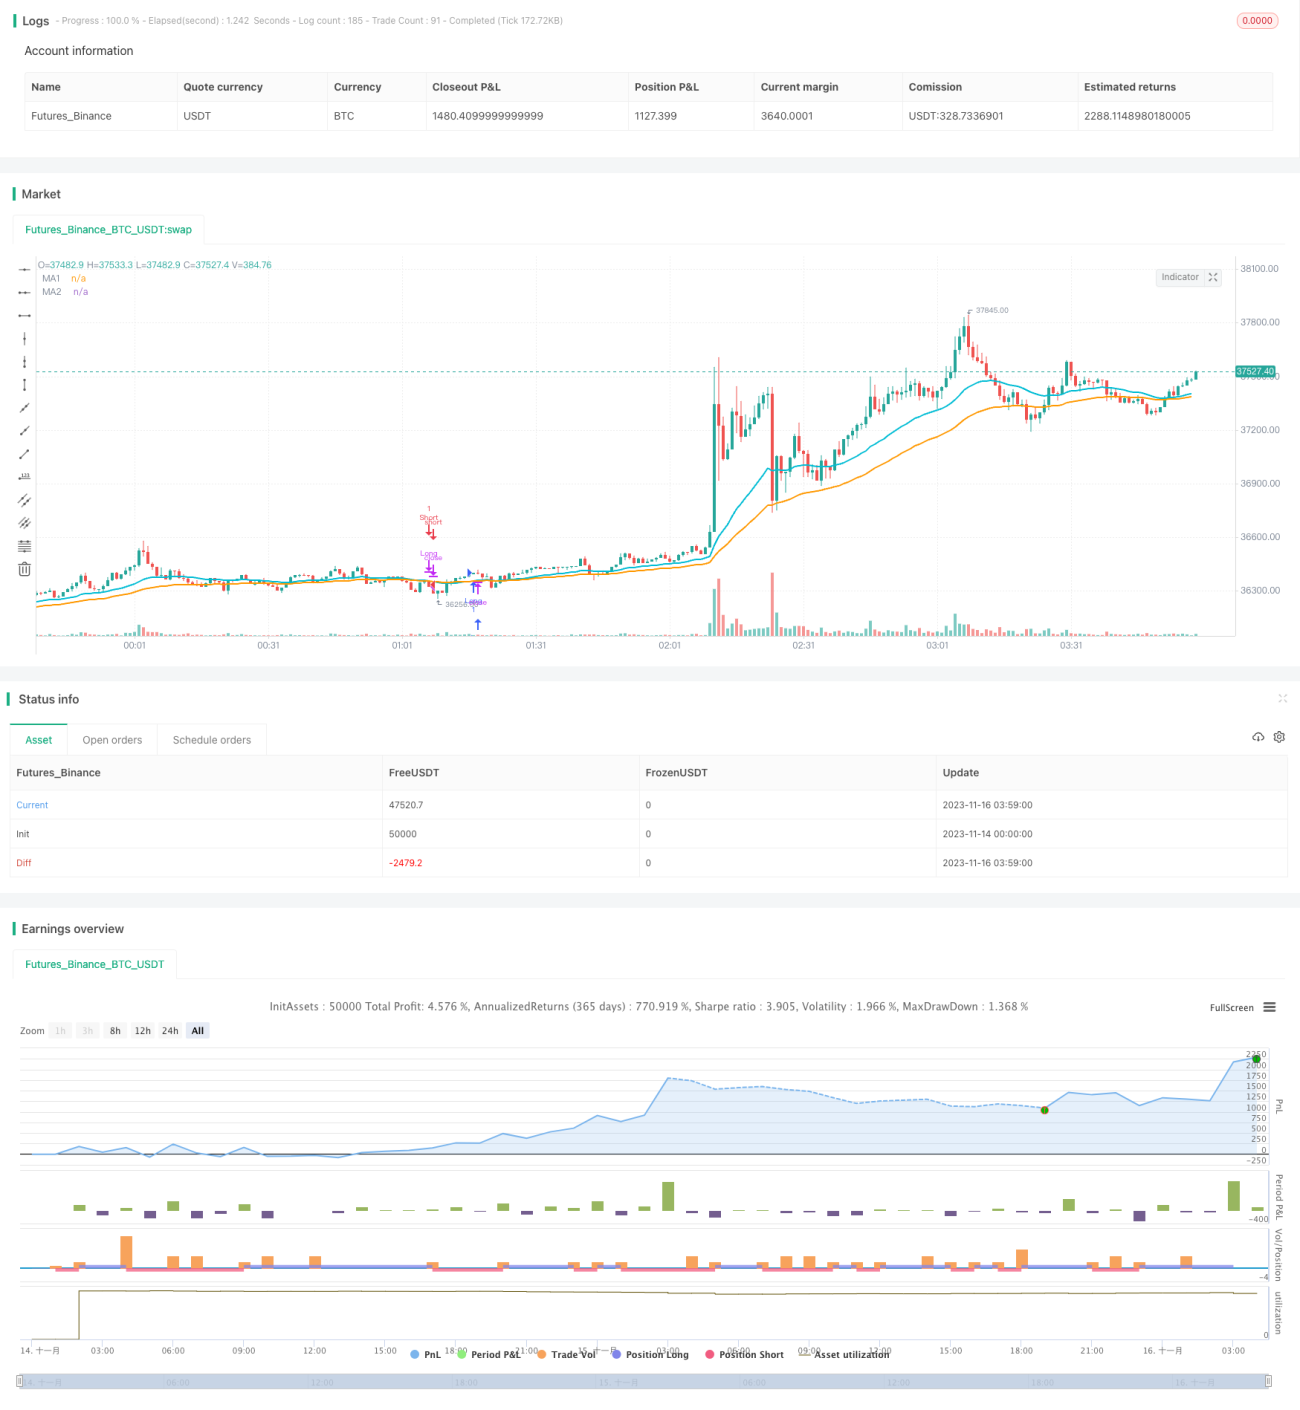
/*backtest
start: 2023-11-14 00:00:00
end: 2023-11-16 04:00:00
period: 1m
basePeriod: 1m
exchanges: [{"eid":"Futures_Binance","currency":"BTC_USDT"}]
*/

//@version=3
// Simple yet effective MA cross strategy.
// You'll have to tune the parameters to get an optimal win ratio.
// If JPY or XAU or any other currency with pips defined as the Strategy parameters
Related strategies
Comment
All comments (0)
No data
- 1