
이 전략의 목적은 트렌디스 주식 (또는 다른 트렌디스 시장) 을 추적하는 낮은 위험 전략으로 최소의 회수율을 달성하기 위한 것이다. 예를 들어, 이 글을 쓰는 시점에서 AAPL은 약 1.36%의 회수율, FB는 약 1.93%의 회수율, 그리고 SPY는 0.80%의 회수율을 가지고 있으며, 모두 수익성이 유지된다.
이 전략은 200일 이동 평균선, 사용자 정의 브린 밴드, 52주기 가중 이동 평균 TSI 및 ADX 강도를 이용한다.
구매 신호는 200일 이동 평균 이상의 종전 가격 + 5K 선의 종전 가격 상부 사용자 정의 브린 띠보다 높다 + TSI는 긍정적 + ADX는 20보다 높다.
역시험으로 증명된 바에 따르면, 이 전략은 유행 주식에만 적용되며, 일부 매매/하하 조건이 삭제되어, 단지 다중 주문만을 적용한다.
이 전략의 장점은 회수율이 낮고 위험이 최소이며, 대부분의 트렌디스 주식의 저위험 운용에 적합하며, 테스트 데이터에 따르면 수익성이 높으며 재검토 기간 동안 AAPL만이 1.36%의 최대 회수, FB가 1.93%의 최대 회수였다.
부린 밴드, MA 평균선, TSI 지표 등 여러 가지 기술 지표를 조합하여 ADX를 설정하여 강하고 약한 추세를 판단하고, 추세 상승을 판단할 때 구매하여, 추세 주식의 중장선에서 승률을 잡기 위해 시도합니다. 단일 지표 판단에 비해이 전략은 여러 가지 기술 지표를 통합하여 판단이 더 정확하고 신뢰할 수 있으며 위험이 낮습니다.
이 전략은 또한 손실을 막는 전략을 포함하고 있으며, TSI 지표 방향이 바뀌면 적당히 손실을 막고, 수익을 최대한 잠금하고, 위험을 효과적으로 제어합니다.
이 전략의 위험은 크게 두 가지입니다.
갑작스러운 사건 위험. 일부 블랙 스 사건은 주식이 급격히 하락하여 손실을 막을 수 없습니다.
트렌드 종료 위험. 주식이 트렌드에서 청산될 때, 큰 회전이 발생할 수 있다.
리스크 1에 대해 더 엄격한 손해 차단 메커니즘을 설정하거나 인위적 개입으로 손해 차단할 수 있다. 리스크 2에 대해 더 많은 판단 요소 검출 트렌드 종료, 예를 들어 거래량 지표 증가 등이 결합될 수 있다.
이 전략은 다음과 같은 부분에서 최적화될 수 있습니다.
더 많은 스톱 로드 전략, 더 정확한 스톱 로드 포인트를 설정하고, 더 나은 리스크 관리를 한다.
평균선 변수를 최적화하고, 다양한 변수 조합의 안정성을 테스트한다.
트렌드의 시작과 끝을 더 정확하게 판단할 수 있는 판단 시스템, 예를 들어 양력 지표가 증가한다.
더 긴 시간 주기의 변수를 테스트하여 더 긴 선의 동작에 적응한다.
이 전략은 ADX를 통해 트렌드 강도를 판단하고, TSI 지표는 트렌드 방향을 판단하고, 브린 띠를 판단하고, 이동 평균은 장기적인 경향을 판단하고, 여러 지표가 상호 검증하고, 구매 시기를 판단한다. 중지 손실 전략은 위험을 효과적으로 제어 할 수 있다. 이 전략은 긴 라인 트렌드 추종 주식, 회수율이 낮고, 수익이 높기 때문에 어느 정도 장점이 있다.
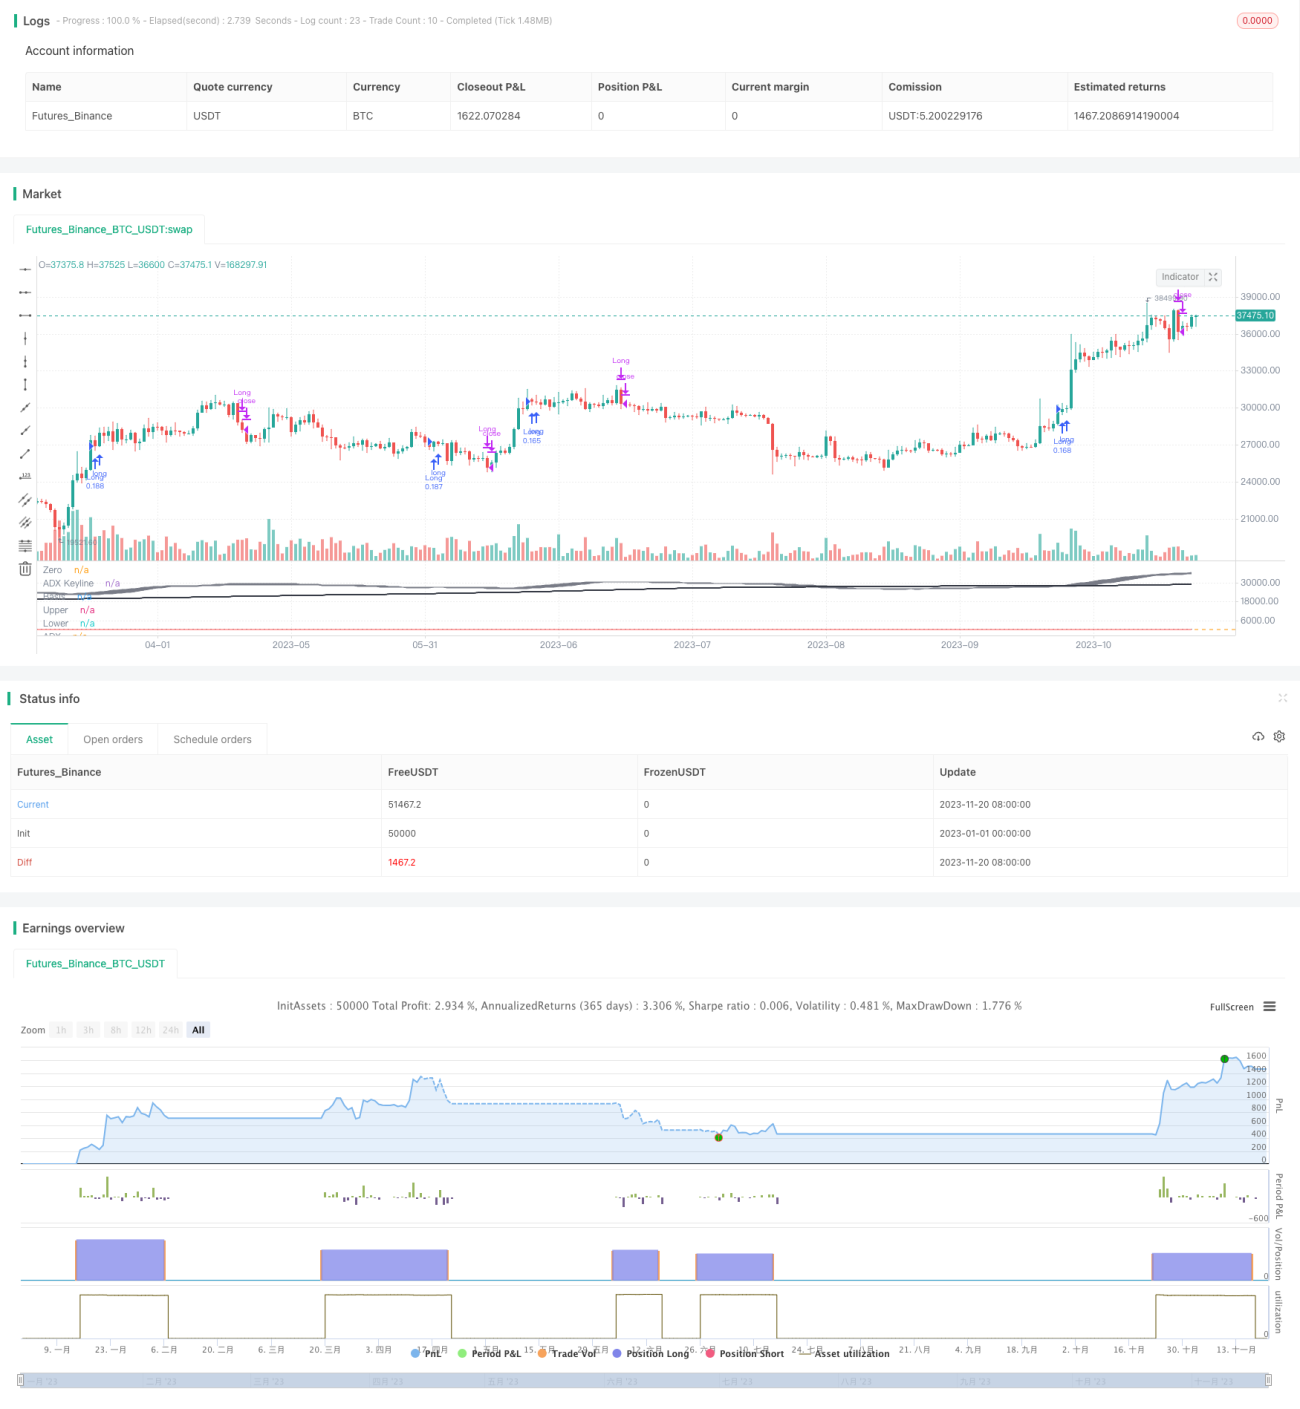
/*backtest
start: 2023-01-01 00:00:00
end: 2023-11-21 00:00:00
period: 1d
basePeriod: 1h
exchanges: [{"eid":"Futures_Binance","currency":"BTC_USDT"}]
*/
// This source code is subject to the terms of the Mozilla Public License 2.0 at https://mozilla.org/MPL/2.0/
// © gary_trades
//This script has been designed to be used on trending stocks as a low risk trade with minimal drawdown, utilising 200 Moving Average, Custom Bollinger Band, TSI with weighted moving average and ADX strength.
//Backtest dates are set to 2010 - 2020 and all other filters (moving average, ADX, TSI , Bollinger Band) are not locked so they can be user amended if desired.
//Buy signal is given when trading above the 200 moving average + 5 candles have closed above the upper custom Bollinger + the TSI is positive + ADX is above 20.
//As back testing proved that this traded better only in tends then some Sell/Short conditions have been removed and this focueses on Long orders.
//Only requires 2 additional lines of code to add shorting orders.
//Close for either long or short trades is signaled once the TSI crosses in the opposite direction indicating change in trend strength or if stop loss is trggered.
//Further optimization could be achieved by adding a stop loss.
//NOTE: This only shows the lower indicators however for visualization you can use my script "CUSTOM BOLLINGER WITH SMA", which is the upper indicators in this stratergy.
//------------
//@version=4
strategy(shorttitle="Trend Chaser", title="ADX_TSI_Bol Band Trend Chaser", overlay=false, pyramiding=0,
currency=currency.USD, default_qty_type=strategy.percent_of_equity, default_qty_value=10,
initial_capital=10000, commission_value=0.1)
//------------
//Custom Bollinger Band
length = input(20, minval=1)
src = input(close, title="Source")
mult = input(0.382, minval=0.001, maxval=50, title="StdDev")
basis = sma(src, length)
dev = mult * stdev(src, length)
upper = basis + dev
lower = basis - dev
offset = input(0, "Offset", type = input.integer, minval = -500, maxval = 500)
plot(basis, "Basis", color=color.gray, offset = offset, display=display.none)
p1 = plot(upper, "Upper", color=color.gray, offset = offset, display=display.none)
p2 = plot(lower, "Lower", color=color.gray, offset = offset, display=display.none)
fill(p1, p2, title = "Background", color=#787B86, transp=85)
//------------
//Moving Average
MAlen = input(200, minval=1, title="Length")
MAout = sma(src, MAlen)
plot(MAout, color=color.black, title="MA", offset=offset, linewidth=2, display=display.none)
//------------
//True Strength WMA
TSlong = input(title="Long Length", type=input.integer, defval=25)
TSshort = input(title="Short Length", type=input.integer, defval=13)
TSsignal = input(title="Signal Length", type=input.integer, defval=52)
double_smooth(src, TSlong, TSshort) =>
fist_smooth = wma(src, TSlong)
wma(fist_smooth, TSshort)
price = close
pc = change(price)
double_smoothed_pc = double_smooth(pc, TSlong, TSshort)
double_smoothed_abs_pc = double_smooth(abs(pc), TSlong, TSshort)
tsi_value = 100 * (double_smoothed_pc / double_smoothed_abs_pc)
tsi2 = wma(tsi_value, TSsignal)
plot(tsi_value, color=color.blue)
plot(wma(tsi_value, TSsignal), color=color.red)
hline(0, title="Zero")
//------------
//ADX
adxlen = input(13, title="ADX Smoothing")
dilen = input(13, title="DI Length")
keyLevel = input(20, title="Keylevel for ADX")
dirmov(len) =>
up = change(high)
down = -change(low)
plusDM = na(up) ? na : (up > down and up > 0 ? up : 0)
minusDM = na(down) ? na : (down > up and down > 0 ? down : 0)
truerange = rma(tr, len)
plus = fixnan(100 * rma(plusDM, len) / truerange)
minus = fixnan(100 * rma(minusDM, len) / truerange)
[plus, minus]
adx(dilen, adxlen) =>
[plus, minus] = dirmov(dilen)
sum = plus + minus
adx = 100 * rma(abs(plus - minus) / (sum == 0 ? 1 : sum), adxlen)
sig = adx(dilen, adxlen)
plot(sig, color=color.black, title="ADX", style=plot.style_histogram, transp=40)
plot(20, color=color.green, title="ADX Keyline", linewidth=1)
//------------
//Identify Triggers
//Back Test Range
start = timestamp("America/New_York", 2010, 1, 1, 9,30)
end = timestamp("America/New_York", 2030, 7, 1, 0, 0)
//Custom Bollinger Band
Long1 = close > upper[5] and close[5] > upper [6]
Short1 = close < lower[5] and close[5] < lower [6]
//Moving Average
Long2 = close >= MAout[1]
Short2 = close <= MAout[1]
//True Strength WMA
Long3 = tsi_value > tsi2
Short3 = tsi_value < tsi2
//ADX
ADXkey = adx(dilen, adxlen) > 20 and adx(dilen, adxlen) < 100
//Buy
Buy = Long1 and Long2 and Long3 and ADXkey
CloseLong = crossunder(tsi_value,tsi2)
//Short
Sell = Short1 and Short2 and Short3 and ADXkey
CloseShort = crossover(tsi_value,tsi2)
//------------
//Entry and Exit
if time >= start and time <= end
strategy.entry("Long", true, when = Buy)
strategy.close("Long", when = CloseLong)