여러 지표에 기초한 존의 비트코인 내일 거래 전략

저자:차오장, 날짜: 2023-12-07 15:23:44
태그:

img

전반적인 설명

이 전략은 RSI, MFI, Stoch RSI 및 MACD 네 개의 지표를 결합하여 비트코인 내일 거래를 구현합니다. 여러 지표가 위험을 제어하기 위해 동시에 구매 또는 판매 신호를 제공하는 경우에만 주문이 제공됩니다.

전략 논리

  1. RSI 지표는 시장이 과소매 또는 과소매인지 결정하는 데 사용됩니다. RSI가 40 이하일 때 구매 신호를 생성하고 RSI가 70 이상일 때 판매 신호를 생성합니다.

  2. 이 MFI 지표는 시장에서의 자본 흐름을 판단합니다. MFI가 23보다 낮을 때 구매 신호를 생성하고 MFI가 80보다 높을 때 판매 신호를 생성합니다.

  3. 스톡 RSI 지표는 시장이 과잉 매입 또는 과잉 판매 여부를 결정합니다. K 라인이 34 이하일 때 구매 신호를 생성하고 80 이상일 때 판매 신호를 생성합니다.

  4. MACD 지표는 시장 추세와 동력을 판단합니다. 빠른 선이 느린 선 아래에 있고 히스토그램이 부정적인 경우 구매 신호와 반대 시나리오에 판매 신호를 생성합니다.

이점 분석

  1. 네 가지 주요 지표를 결합하면 신호 정확도가 향상되고 단일 지표의 장애로 인한 손실이 피할 수 있습니다.

  2. 주문은 여러 지표가 동시에 신호를 내릴 때만 이루어집니다. 이는 잘못된 신호의 확률을 크게 감소시킵니다.

  3. 내일 거래 전략을 채택하면 하루 하루의 위험을 피하고 자본 비용을 줄일 수 있습니다.

위험 과 해결책

  1. 전략의 거래 빈도는 상대적으로 낮을 수 있으며, 일정 시간적 위험이 있습니다. 거래 수를 증가시키기 위해 지표 매개 변수를 적절히 완화 할 수 있습니다.

  2. 여전히 지표가 잘못된 신호를 줄 가능성이 있습니다. 기계 학습 알고리즘은 지표 신호의 신뢰성을 판단하는 데 도움이 될 수 있습니다.

  3. 일부 과잉 구매 및 과잉 판매 위험이 있습니다. 지표 매개 변수는 그에 따라 조정되거나 더 많은 지표 논리를 추가 할 수 있습니다.

최적화 방향

  1. 적응적 인 지표 매개 변수 기능을 추가합니다. 시장 변동성과 변화 속도를 기반으로 실시간으로 지표 매개 변수를 조정합니다.

  2. 스톱 로스 로직을 추가합니다. 손실이 특정 비율을 초과하면 출구 스톱 로스를 추가하여 단일 손실을 효과적으로 제어합니다.

  3. 감정 지표를 포함합니다. 전략 수익 공간을 개선하기 위해 시장 열과 시장 두려움과 같은 다차원 판단을 증가시킵니다.

결론

네 가지 주요 지표를 통해 신호를 검증함으로써이 전략은 잘못된 신호 비율을 효과적으로 줄일 수 있으며 상대적으로 안정적인 고 주파수 수익 전략입니다. 매개 변수 및 모델의 지속적인 최적화로 전략의 승률과 수익성이 더욱 향상 될 수 있습니다.


/*backtest
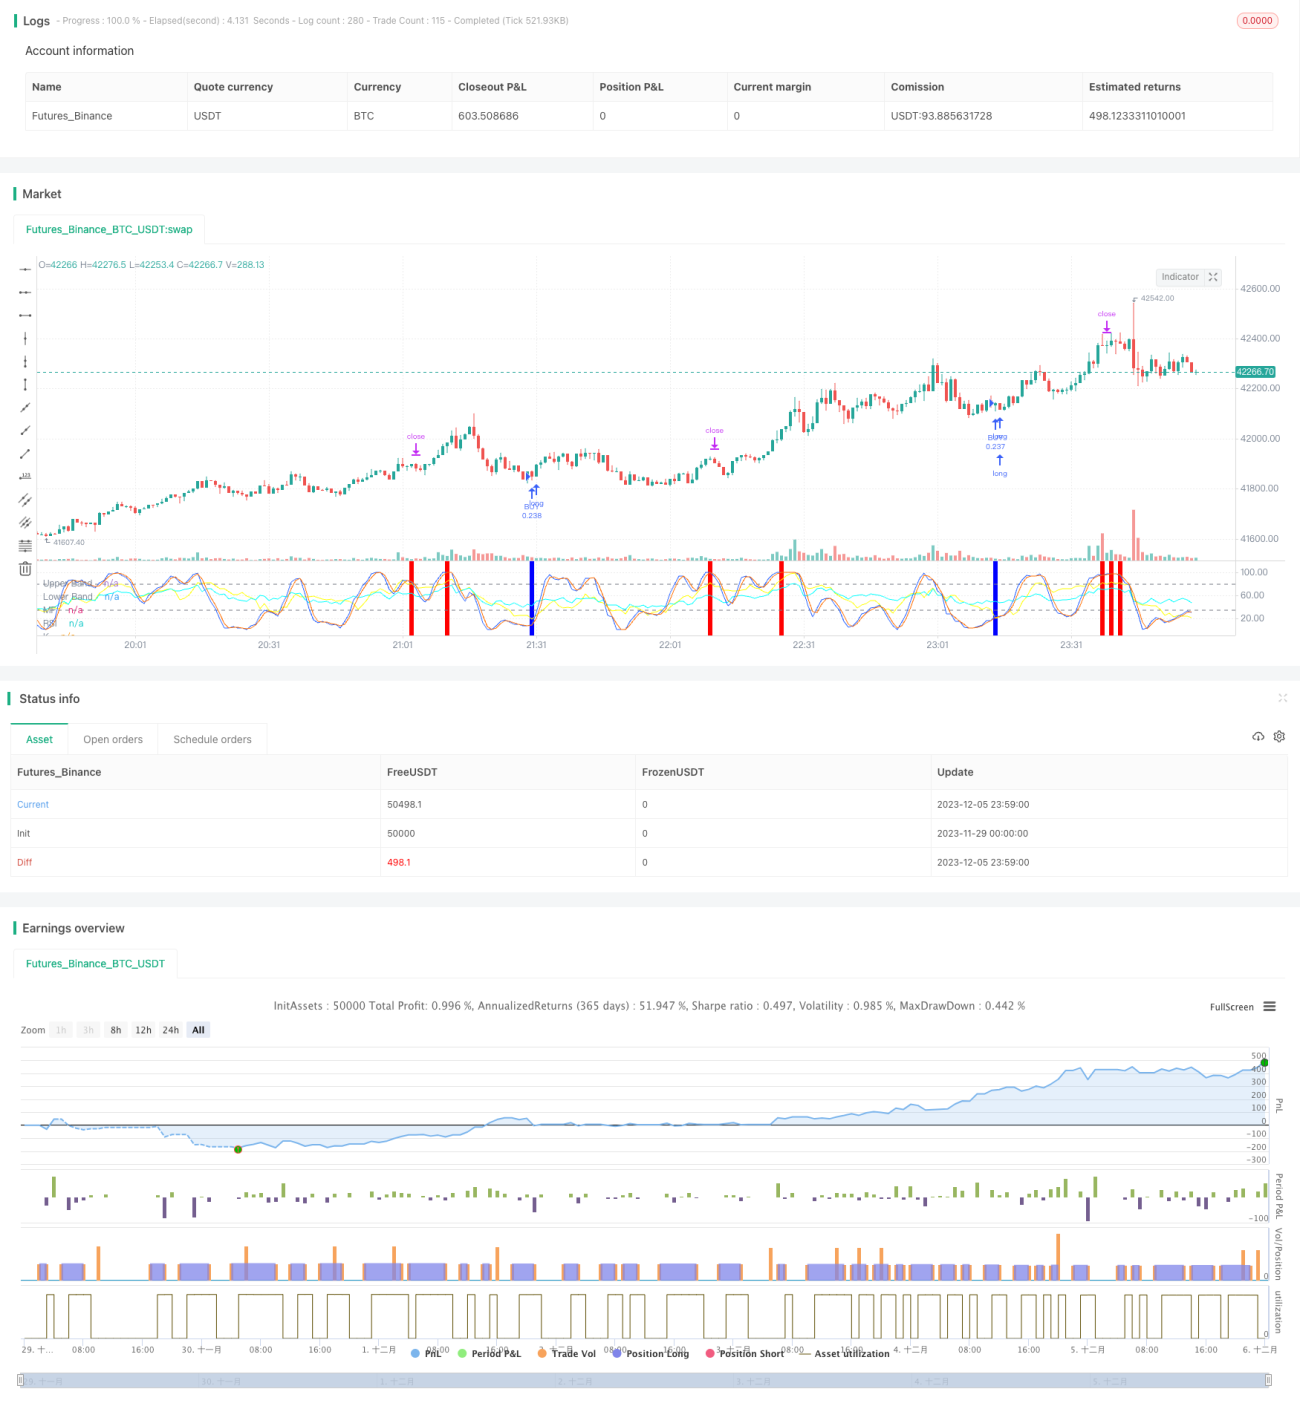
start: 2023-11-29 00:00:00
end: 2023-12-06 00:00:00
period: 1m
basePeriod: 1m
exchanges: [{"eid":"Futures_Binance","currency":"BTC_USDT"}]
*/


//@version=5
strategy('John Day Stop Loss', overlay=false, pyramiding=1, default_qty_type=strategy.cash, default_qty_value=10000, initial_capital=10000, currency='USD', precision=2)
strategy.risk.allow_entry_in(strategy.direction.long) 

from_day = input.int(defval=1, title='From Day', minval=1)
from_month = input.int(defval=1, title='From Month', minval=1)
from_year = input.int(defval=2021, title='From Year', minval=2020)
to_day = input.int(defval=1, title='To Day', minval=1)
to_month = input.int(defval=1, title='To Month', minval=1)
to_year = input.int(defval=2025, title='To Year', minval=2020)

time_cond = time > timestamp(from_year, from_month, from_day, 00, 00) and time < timestamp(to_year, to_month, to_day, 00, 00)
//time_cond = true

//Stop Loss
longProfitPerc = input.float(title="Stop Loss Profit (%)", defval=2.1) / 100
longExitPrice  = strategy.position_avg_price * (1 - longProfitPerc)

//RSI - yellow
up = ta.rma(math.max(ta.change(close), 0), 14)
down = ta.rma(-math.min(ta.change(close), 0), 14)
rsi = down == 0 ? 100 : up == 0 ? 0 : 100 - (100 / (1 + up / down))
plot(rsi, "RSI", color=#00FFFF)
buy_rsi = true // rsi < 40
sell_rsi = true //rsi > 70

//MFI - cyan
mf = ta.mfi(hlc3, 14)
plot(mf, "MF", color=#FFFF00)
buy_mfi = mf < input.int(defval=23, title='Max MF', minval=1)
sell_mfi = mf > input.int(defval=80, title='Min MF', minval=1)

//Stoch RSI
OverBought_StochRSI = input(80)
OverSold_StochRSI = input(34)
smoothK = input.int(3, "K", minval=1)
smoothD = input.int(2, "D", minval=1)
lengthRSI = input.int(14, "RSI Length", minval=1)
lengthStoch = input.int(14, "Stochastic Length", minval=1)
srcRSI = input(close, title="RSI Source")
rsi1 = ta.rsi(srcRSI, lengthRSI)
kStochRSI = ta.sma(ta.stoch(rsi1, rsi1, rsi1, lengthStoch), smoothK)
d = ta.sma(kStochRSI, smoothD)
co = ta.crossover(kStochRSI,d)
cu = ta.crossunder(kStochRSI,d)

buy_stochRSI = co and kStochRSI < OverSold_StochRSI
sell_stochRSI = cu and kStochRSI > OverBought_StochRSI

plot(kStochRSI, "K", color=#2962FF)
plot(d, "D", color=#FF6D00)
h0 = hline(OverBought_StochRSI, "Upper Band", color=#787B86)
h1 = hline(OverSold_StochRSI, "Lower Band", color=#787B86)
fill(h0, h1, color=color.rgb(33, 150, 243, 90), title="Background")

//MACD
// Getting inputs
fast_length = input(title="Fast Length", defval=12)
slow_length = input(title="Slow Length", defval=26)
src = input(title="Source", defval=close)
signal_length = input.int(title="Signal Smoothing",  minval = 1, maxval = 50, defval = 9)
sma_source = input.string(title="Oscillator MA Type",  defval="EMA", options=["SMA", "EMA"])
sma_signal = input.string(title="Signal Line MA Type", defval="EMA", options=["SMA", "EMA"])
// Plot colors
//col_macd = input(#2962FF, "MACD Line  ", group="Color Settings", inline="MACD")
//col_signal = input(#FF6D00, "Signal Line  ", group="Color Settings", inline="Signal")
//col_grow_above = input(#26A69A, "Above   Grow", group="Histogram", inline="Above")
//col_fall_above = input(#B2DFDB, "Fall", group="Histogram", inline="Above")
//col_grow_below = input(#FFCDD2, "Below Grow", group="Histogram", inline="Below")
//col_fall_below = input(#FF5252, "Fall", group="Histogram", inline="Below")
// Calculating
fast_ma = sma_source == "SMA" ? ta.sma(src, fast_length) : ta.ema(src, fast_length)
slow_ma = sma_source == "SMA" ? ta.sma(src, slow_length) : ta.ema(src, slow_length)
macd = fast_ma - slow_ma
signal = sma_signal == "SMA" ? ta.sma(macd, signal_length) : ta.ema(macd, signal_length)
hist = macd - signal
buy_MACD = macd < signal and hist < 0 
sell_MACD = macd > signal and hist > 0 

//buy_MACD = true 
//sell_MACD = true

//plot(hist, title="Histogram", style=plot.style_columns, color=(hist>=0 ? (hist[1] < hist ? col_grow_above : col_fall_above) : (hist[1] < hist ? col_grow_below : col_fall_below)))
//plot(macd, title="MACD", color=col_macd)
//plot(signal, title="Signal", color=col_signal)

sessionColor = color(na)
if time_cond

    if (not na(kStochRSI) and not na(d))
        cmt = str.tostring(close)
    	if (buy_stochRSI and buy_MACD and buy_mfi and buy_rsi)
    		strategy.entry("BUY", strategy.long, comment='BUY @ ' + cmt)
    		if longProfitPerc != 0
    		    strategy.exit(id="x", stop=longExitPrice, comment='EXIT @ ' + str.tostring(longExitPrice))
        	sessionColor := input.color(#0000FF, "buy") //red
    	if (sell_stochRSI and sell_MACD and sell_mfi and sell_rsi)
    		strategy.entry("SELL", strategy.short, comment='SELL @ ' + cmt)
    		sessionColor := input.color(#FF0000, "sell") //green
    	
bgcolor(sessionColor)

더 많은