MACD 지표를 기반으로 한 양방향 거래 전략

1
Follow
1778
Followers
개요
이 전략은 MACD 지표에 기반한 양방향 거래 전략을 구현한다. MACD 지표의 금포크와 사다리 시에는 각각 오이닝과 오피닝을 할 수 있으며, 다른 지표 판단과 함께 일부 신호를 필터링 할 수 있다.
전략 원칙
이 전략은 주로 MACD 지표를 사용하여 양방향 거래를 수행한다. 구체적으로, 그것은 빠른 이동 평균, 느린 이동 평균 및 MACD 신호선을 계산한다. 빠른 이동 평균 상에서 느린 이동 평균을 통과 할 때 골드 포크 신호를 생성한다. 빠른 이동 평균 아래에서 느린 이동 평균을 통과 할 때 죽은 포크 신호를 생성한다.
일부 무효 신호를 필터링하기 위해, 이 전략은 또한 ± 30 범위를 필터로 설정하여 MACD 기둥이 이 범위를 초과 할 때만 거래 신호를 유발합니다. 또한, 평소 상태에서 MACD 기둥이 방향을 판단하여 연속적으로 두 기둥의 방향이 바뀌었을 때만 평소됩니다.
전략적 이점
- MACD 지표를 주요 거래 신호로 사용한다. 이 지표는 양방향 주식 시장의 상황에 상대적으로 민감하다.
- 필터를 추가하여 일부 무효 신호를 필터링할 수 있습니다.
- 연속적으로 두 기둥의 방향을 판단하는 평지 논리를 사용하여 가짜 돌파구를 어느 정도 피할 수 있습니다.
전략적 위험
- MACD 지표는 과도한 거래 빈도를 초래할 수 있는 빈번한 거래 신호를 발생시킬 수 있습니다.
- 단일 지표 전략, 신호의 약간의 지연은 손실을 초래할 수 있습니다.
- 기둥선 방향 판단에 대한 평형상승 논리는 충분히 엄격하지 않아 신호가 누락될 위험이 있다.
전략 최적화 방향
- 다른 지표와 함께 신호를 확인하는 것을 고려할 수 있습니다. 예를 들어, KDJ 지표, 브린 밴드 지표 등
- KD 등과 같은 MACD 지표를 대체할 수 있는 다른 더 진보된 지표를 연구할 수 있다.
- 평정 위치 논리를 최적화하고 단편 손실을 제어하기 위해 스톱로스 및 스톱을 설정할 수 있습니다.
요약하다
이 전략은 전반적으로 기본적으로 사용할 수 있는 양방향 거래 전략이다. MACD 지표의 장점을 이용하면서도 신호의 질을 제어하기 위해 필터를 추가한다. 그러나 MACD 지표 자체에도 문제가 있으며, 실장에서 더 많은 테스트와 최적화가 필요하기 때문에 전략이 더 신뢰할 수 있다.
]
Source
Pine
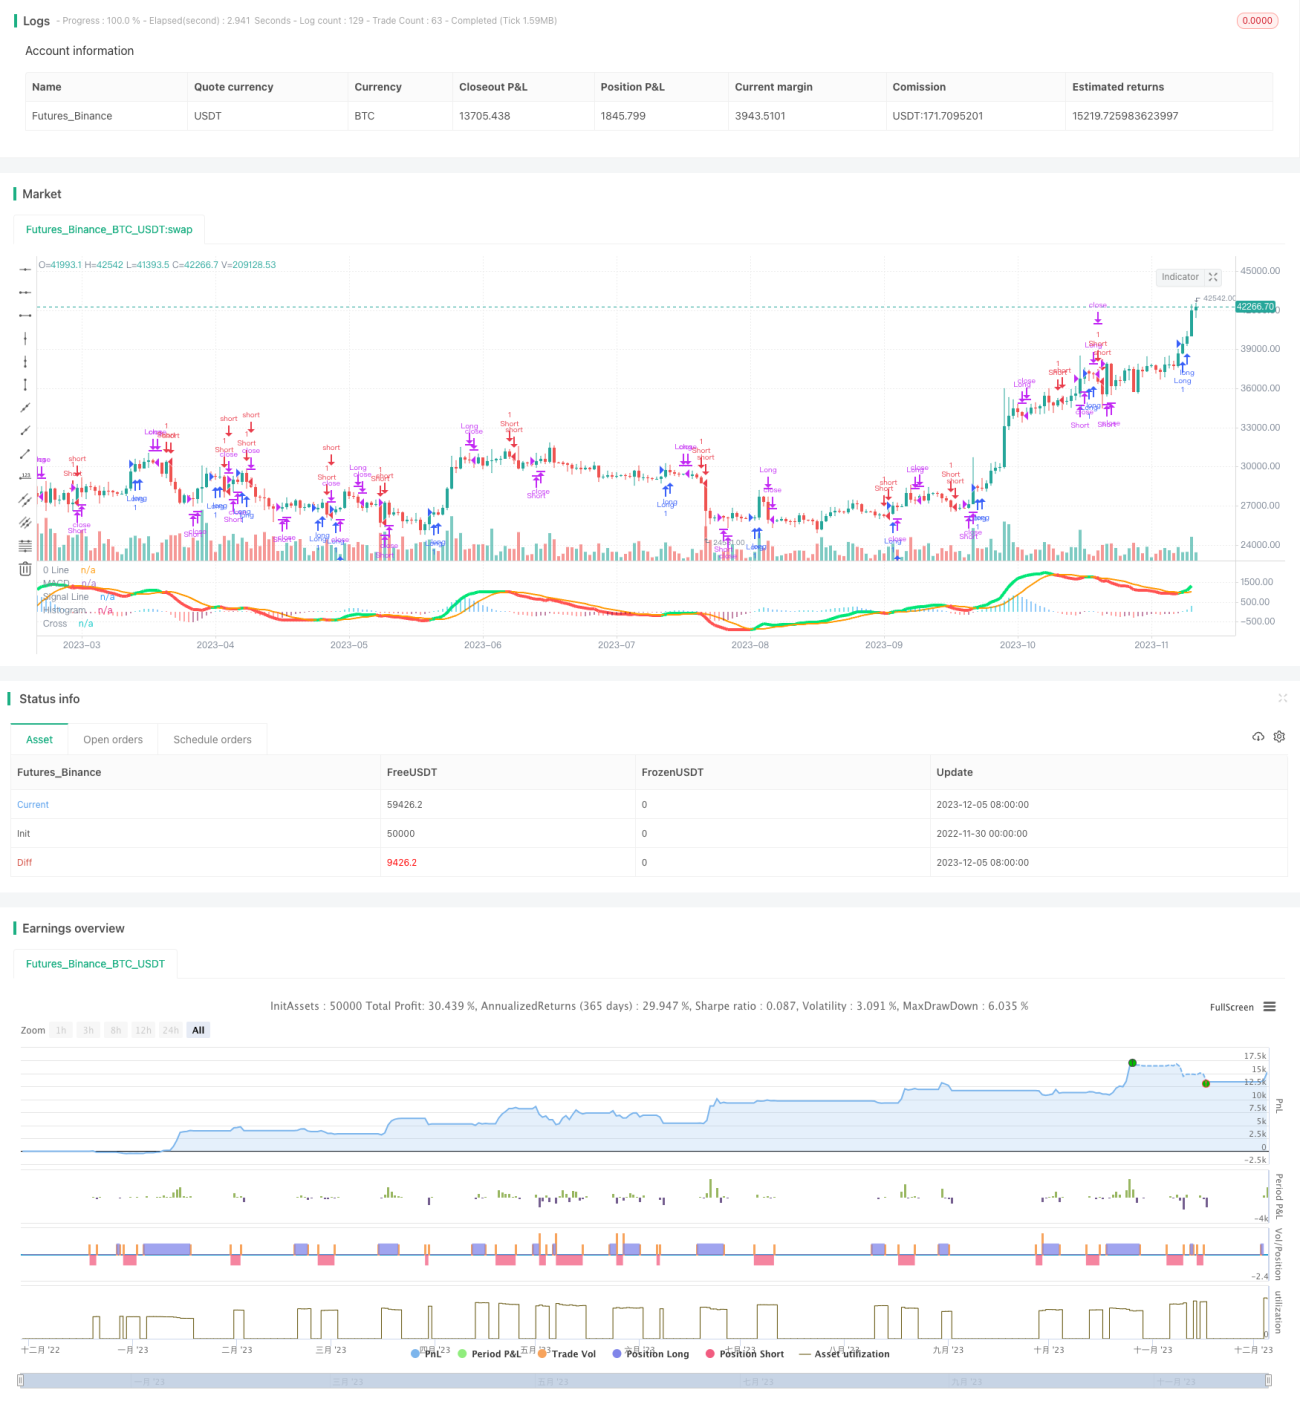
/*backtest
start: 2022-11-30 00:00:00
end: 2023-12-06 00:00:00
period: 1d
basePeriod: 1h
exchanges: [{"eid":"Futures_Binance","currency":"BTC_USDT"}]
*/

//@version=3

//Created by user ChrisMoody updated 4-10-2014
//Regular MACD Indicator with Histogram that plots 4 Colors Based on Direction Above and Below the Zero LineStrategy parameters
Related strategies
Comment
All comments (0)
No data
- 1