개요
이 전략의 핵심 아이디어는 무작위 숫자를 사용하여 동전 오렌지 같은 확률적 사건을 모의하고, 이벤트 결과에 따라 다중 머리 또는 빈 머리를 결정하여 무작위 거래를 실현하는 것입니다. 이러한 거래 전략은 모의 테스트에 사용할 수 있으며 더 복잡한 전략 개발에 대한 기본 프레임 워크로 사용할 수 있습니다.
전략 원칙
통과하다
flip변수 모의 무작위 사건,coinLabel무작위 숫자의 크기가 더 많은 것을 결정하거나 더 많은 것을 결정합니다.사용
risk그리고ratio스탠더드 스탠더드 스탠더드 스탠더드 스탠더드설정된 최대 주기 수에 따라 다음 거래 신호를 무작위로 트리거한다.
통과하다
plotBox변수 컨트롤은 평창 상자를 표시하는지 여부를 결정합니다.stoppedOut그리고takeProfit변수는 손해 중지 또는 정지 검사를 위해 사용됩니다.피드백 기능 테스트 전략의 성능을 제공합니다.
우위 분석
코드 구조가 명확하고, 이해하기 쉽고, 재개발하기 쉽다.
UI는 상호작용 친화적이며, 그래픽 인터페이스를 통해 다양한 매개 변수를 조정할 수 있다.
무작위성이 강하고, 시장의 변동에 영향을 받지 않으며, 신뢰성이 높다.
매개 변수 최적화로 더 나은 수익 수익률을 얻을 수 있다.
다른 전략의 시연이나 테스트로 사용할 수 있습니다.
위험 분석
무작위 거래는 시장에 대한 판단을 할 수 없으며 수익의 위험이 있습니다.
최적의 변수 조합을 결정할 수 없고, 반복적으로 테스트를 해야 한다.
무작위 신호가 너무 밀집되어서 발생할 수 있는 초연결 위험이 있다.
위험을 통제하기 위해 Stop Loss Stop mechanism를 결합하는 것이 좋습니다.
거래 간격을 적절히 늘려서 위험을 줄일 수 있습니다.
최적화 방향
더 복잡한 요소와 결합하여 무작위 신호를 생성한다.
거래 품종을 늘리고, 테스트 범위를 넓혀라.
사용자 인터페이스를 최적화하고, 정책 제어 기능을 추가한다.
더 많은 테스트 도구와 지표를 제공하여 파라미터 최적화를 용이하게 합니다.
거래 신호 또는 스톱 손실 차단 구성 요소로 다른 전략에 추가 될 수 있습니다.
요약하다
이 전략의 전체적인 프레임워크는 무작위적 사건에 기반한 거래 신호를 생성하는, 높은 신뢰성을 갖는다. 또한 파라미터 조정, 재측정 및 지도 기능을 제공한다. 이 전략은 초보자 개발 전략을 테스트하는 데 사용할 수 있으며, 다른 전략의 기본 모듈로도 사용될 수 있다. 적절한 최적화를 통해 전략의 성능을 더욱 두드러지게 할 수 있다.
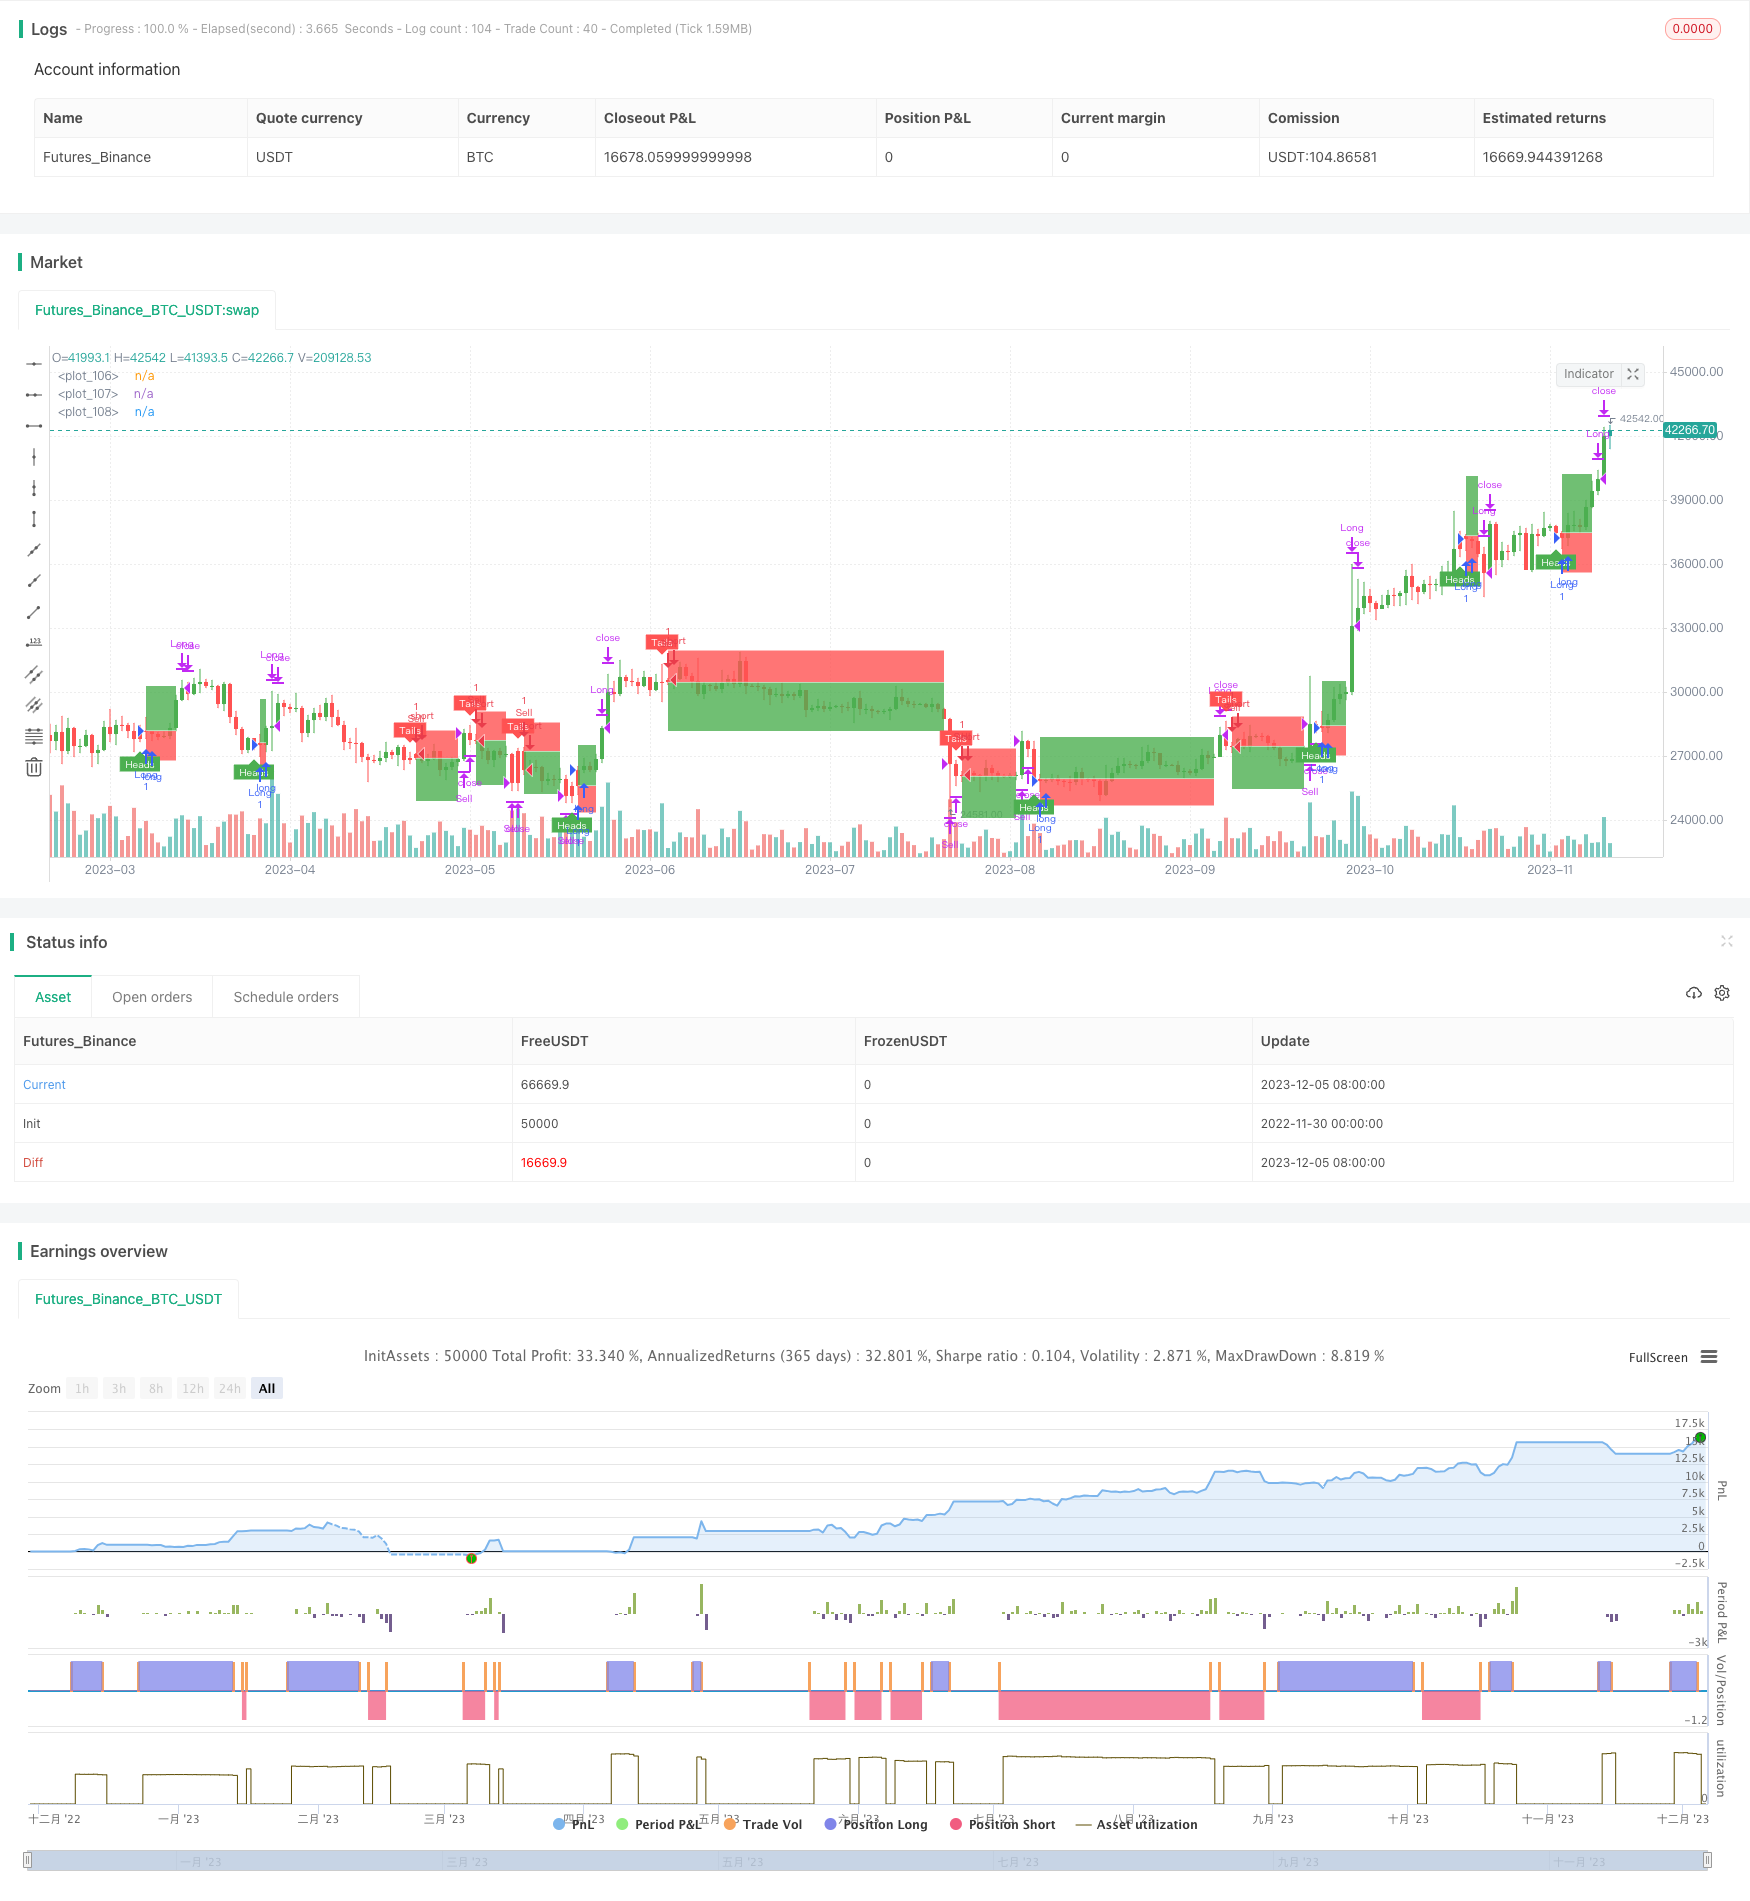
/*backtest
start: 2022-11-30 00:00:00
end: 2023-12-06 00:00:00
period: 1d
basePeriod: 1h
exchanges: [{"eid":"Futures_Binance","currency":"BTC_USDT"}]
*/

// This source code is subject to the terms of the Mozilla Public License 2.0 at https://mozilla.org/MPL/2.0/
// © melodicfish

//@version=4
strategy("Coin Flipper Pro",overlay=true,max_bars_back=100)

// ======= User Inputs variables=========

h1=input(title="------- Trade Activity -------",defval=false)
maxBars=input(25.0,title="Max Bars between Coin Filps",step=1.0,minval=4.0)

h2=input(title="------- Position Settings -------",defval=false)
risk=input(defval=5.0,title="Risk in % ",type=input.float, minval=0.001 ,step=0.1)
ratio= input(defval=1.5,title="Risk to Reward Ratio x:1 ",type=input.float, minval=0.001,step=0.1)

h3=input(title="------- Plot Options -------",defval=false)
showBox=input(defval=true, title="Show Position Boxes")

h4=input(title="------- Back Testing -------",defval=false)
runTest=input(defval=true, title="Run Strategy Back Test")
customTime=input(defval=false, title="Use Custom Date Range for back test")


tsYear = input(2021,minval=1000,maxval=9999,title= "Test Start Year")
tsMonth = input(1,minval=1,maxval=12,title= "Test Start Month")
tsDay = input(1,minval=1,maxval=31,title= "Test Start Day")
start = timestamp(tsYear,tsMonth,tsDay,0,0)

teYear = input(2021,minval=1000,maxval=9999,title=  "Test Stop Year")
teMonth = input(5,minval=1,maxval=12,title=  "Test Stop Month")
teDay = input(1,minval=1,maxval=31,title=  "Test Stop Day")
end = timestamp(teYear,teMonth,teDay,0,0)

// ======= variables =========
var barsBetweenflips=25
var coinFlipResult=0.0
var flip=true
var coinLabel=0.0
var stoppedOut= true
var takeProfit=true
var posLive=false
var p1=0.0
var p2=0.0
var p3=0.0
var plotBox=false
var posType=0
long=false
short=false


// ===== Functions ======

getColor() =>
    round(random(1,255))


// ===== Logic ========
if barssince(flip==true)>barsBetweenflips and posLive==false
    flip:=true
    coinLabel:=random(1,10)

    // Candle Colors
candleColor= flip==true and flip[1]==false and barstate.isconfirmed==false?color.rgb(getColor(),getColor(),getColor(),0):flip==false and close>=open?color.green:color.red
candleColor:= barstate.ishistory==true and close>=open?color.green: barstate.ishistory==true and close<open? color.red:candleColor
barcolor(candleColor)

if flip[1]==true and posLive==false
    flip:=false
    barsBetweenflips:=round(random(3,round(maxBars)))
    posLive:=true

long:= flip[1]==true and coinLabel[1]>=5.0
short:= flip[1]==true and coinLabel[1]<5.0


    // Calculate Position Boxes
if long==true and posType!=1

    riskLDEC=1-(risk/100)
    p1:= close[1]*(1+((risk/100)*ratio)) // TargetLine
    p2:=close[1]
    p3:= close[1]*riskLDEC // StopLine
    plotBox:=true
    posType:=1

if short==true and posType!=-1

    riskSDEC=1-((risk*ratio)/100)
    p1:= close[1]*riskSDEC   // TargetLine
    p2:=close[1]
    p3:= close[1]*(1+(risk/100)) // StopLine
    plotBox:=true
    posType:=-1


    // Check Trade Status
stoppedOut:= posType==1 and long==false and low<= p3? true: posType==-1 and short==false and high>=p3? true: false
takeProfit:= posType==1 and long == false and high>= p1? true: posType==-1 and short==false and low<=p1? true: false
if stoppedOut==true or takeProfit==true
    posType:=0
    plotBox:=false
    posLive:=false


// ====== Plots ========
plot1=plot(plotBox and showBox? p1:na,style=plot.style_linebr,color=color.white, transp= 100)
plot2=plot(plotBox and showBox? p2:na,style=plot.style_linebr,color=color.white, transp= 100)
plot3=plot(plotBox and showBox? p3:na,style=plot.style_linebr,color=color.white, transp= 100)
fill(plot1,plot2,color= color.green)
fill(plot2,plot3,color= color.red)
plotshape(flip==true and flip[1]==false and coinLabel>=5.0,style=shape.labelup,location=location.belowbar, color=color.green,size=size.tiny,title="short label",text="Heads",textcolor=color.white)
plotshape(flip==true and flip[1]==false and coinLabel<5.0,style=shape.labeldown,location=location.abovebar, color=color.red,size=size.tiny,title="short label",text="Tails",textcolor=color.white)
if stoppedOut==true
    label.new(bar_index-1, p3, style=label.style_xcross, color=color.orange)
if takeProfit==true
    label.new(bar_index-1, p1, style=label.style_flag, color=color.blue)


if runTest==true and customTime==false or runTest==true and customTime==true and time >= start and time <= end
    strategy.entry("Sell", strategy.short,when=short==true)
    strategy.close("Sell", comment="Close Short", when=stoppedOut==true or takeProfit==true)
    strategy.entry("Long", strategy.long,when=long==true)
    strategy.close("Long",comment="Close Long", when= stoppedOut==true or takeProfit==true )