Bollinger+RSI 듀얼 전략(롱 전용) v1.2

1
Follow
1778
Followers
1 전략 이름
Bollinger + RSI 쌍중 다중 전략
2 전략 개요
이 전략은 부린 라인 지표와 RSI 지표의 조합을 이용하여 둘 다 동시에 오버 소드 신호를 표시할 때 더 많은 포지션을 만들고, 둘 다 동시에 오버 소드 신호를 표시할 때 평소 포지션을 한다. 단일 지표에 비해 거래 신호를 더 안정적으로 확인하고, 가짜 신호를 피한다.
세번째, 전략적 원칙
- RSI를 통해 과매매를 판단하는 방법
- RSI가 50보다 낮으면 과매매가 됩니다.
- RSI가 50보다 높으면 과매매로 간주됩니다.
- 부린 라인을 사용하여 가격 변칙을 판별합니다.
- 하차선 이하의 가격은 과매매로 간주됩니다.
- 오프레일보다 높은 가격은 과매매로 간주됩니다.
- RSI와 부린이 오버셀 신호를 동시에 표시할 때, 더 많은 포지션을 설정합니다.
- RSI 가 50보다 낮습니다.
- 가격 라인은 브린 라인 아래의 철도
- RSI와 부린이 동시에 오버 바이 신호를 표시할 때, 평점
- RSI 가 50보다 높습니다.
- 가격 라인은 브린 라인보다 높습니다.
네, 전략적 장점
- 두 가지 지표가 결합되어 신호가 더 신뢰할 수 있고, 가짜 신호를 피합니다.
- 다중 포지션만 설정하여 논리를 간소화하고 거래 위험을 줄입니다.
다섯째, 전략적 위험과 해결책
- 부린 라인 파라미터가 잘못 설정되어 있고, 상하 레일 제한이 너무 넓어서, 잘못된 거래의 위험이 증가한다.
- 부린 라인 파라미터를 최적화하고 부린 라인 주기 및 표준 차이를 합리적으로 설정합니다.
- RSI 파라미터가 잘못 설정되어 있고, 오버 바이 오버 셀 판단 기준이 잘못 설정되어 있으며, 오버 트레이드의 위험이 증가하고 있습니다.
- RSI 매개 변수를 최적화하고 RSI 주기를 조정하고 과매도 기준을 합리적으로 설정합니다.
- 트렌드가 없는 상황에서 Ravin은 효과적이지 않습니다.
- 트렌드형 지표와 결합하여, 흔들림없는 행동으로 피하십시오.
6 전략적 최적화
- 부린 라인 및 RSI 파라미터 설정을 최적화
- 손해 방지 장치
- MACD와 같은 트렌드형 지표와 함께
- 짧은 선과 긴 선의 결합을 추가합니다.
VII. 결론
이 전략은 부린라인과 RSI의 두 가지 지표의 장점을 결합하여 두 가지 지표가 동시에 오버 바이 오버 셀 신호를 표시 할 때 거래하여 단일 지표가 생성하는 가짜 신호를 방지하여 신호 정확도를 향상시킵니다. 이전 버전과 비교하여 다중 포지션만 구축하여 거래 위험을 감소시킵니다. 이후에는 파라미터 최적화, 스톱 손실 메커니즘 및 트렌드 유형 지표와 결합하여 전략 최적화를 수행하여 다른 시장 환경에 더 적합하게 만들 수 있습니다.
Source
Pine
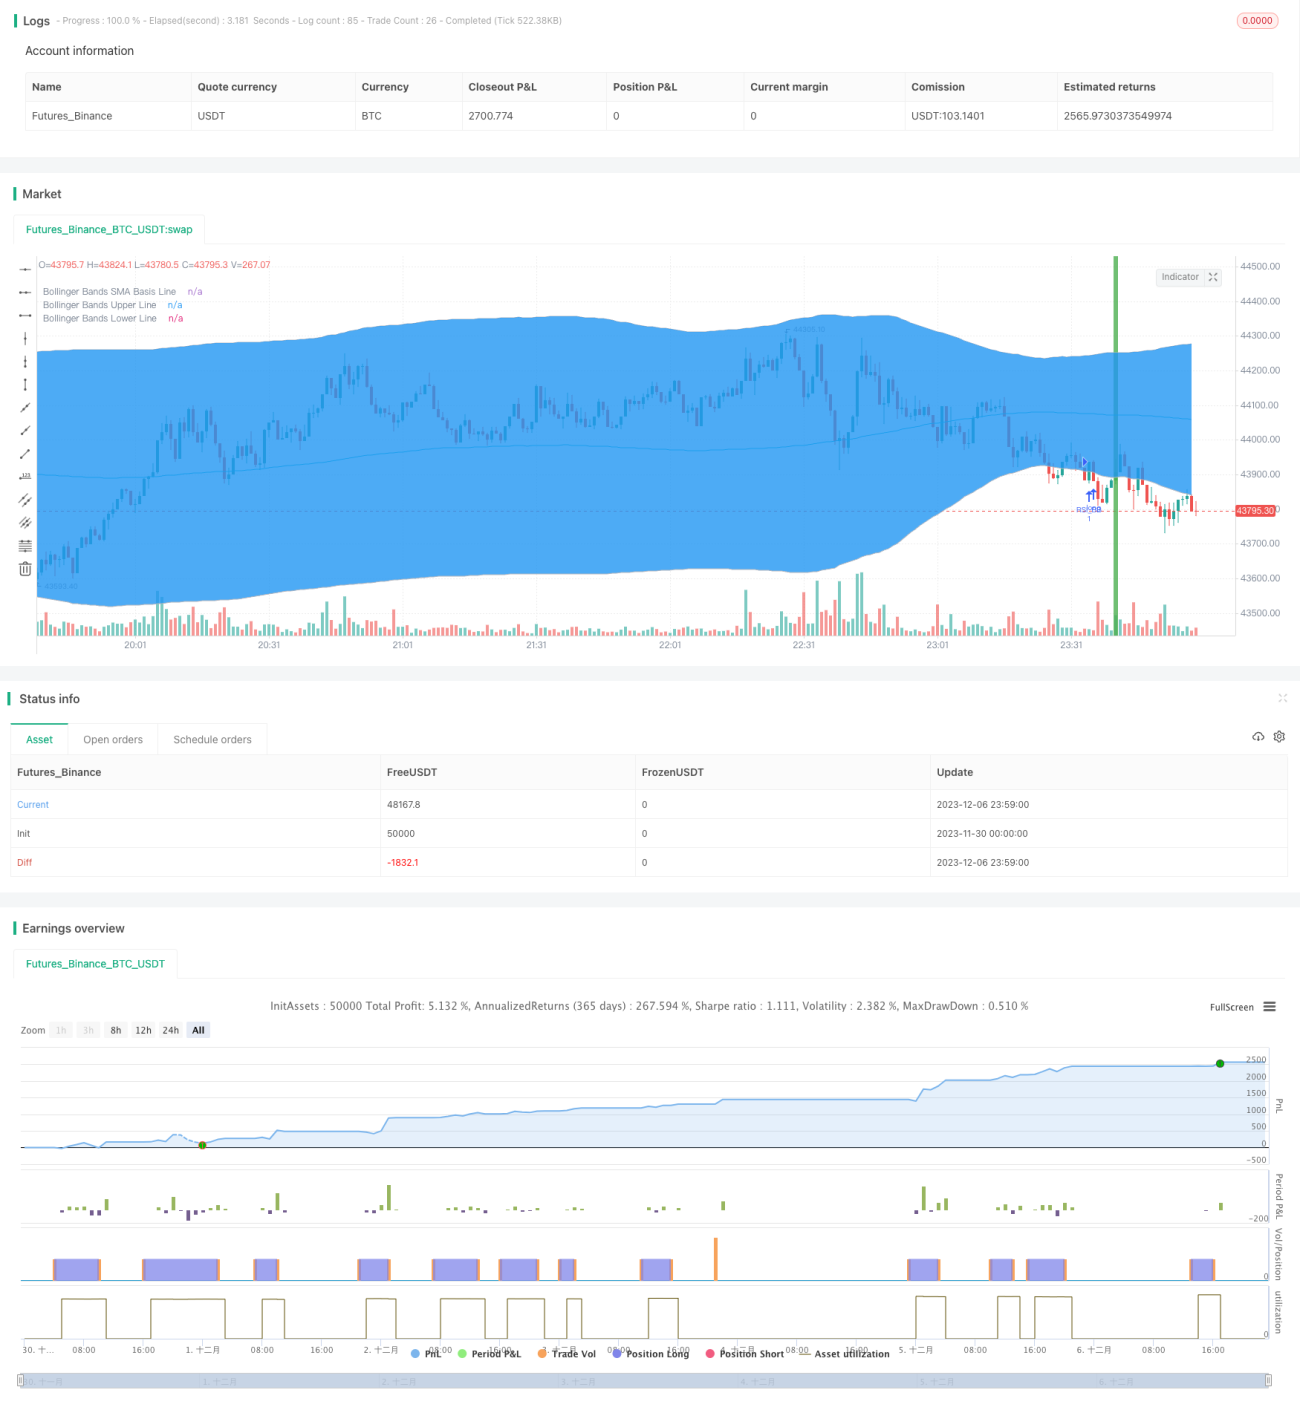
/*backtest
start: 2023-11-30 00:00:00
end: 2023-12-07 00:00:00
period: 1m
basePeriod: 1m
exchanges: [{"eid":"Futures_Binance","currency":"BTC_USDT"}]
*/

//@version=3
strategy("Bollinger + RSI, Double Strategy Long-Only (by ChartArt) v1.2", shorttitle="CA_-_RSI_Bol_Strat_1.2", overlay=true)

// ChartArt's RSI + Bollinger Bands, Double Strategy UPDATE: Long-OnlyStrategy parameters
Related strategies
Comment
All comments (0)
No data
- 1