더블 컨펌 브레이크아웃 전략


생성 날짜: 2023-12-15 12:16:55 마지막으로 수정됨: 2023-12-15 12:16:55
복사: 0 클릭수: 750
avatar of ChaoZhang ChaoZhang
1
집중하다
1621
수행원

더블 컨펌 브레이크아웃 전략

개요

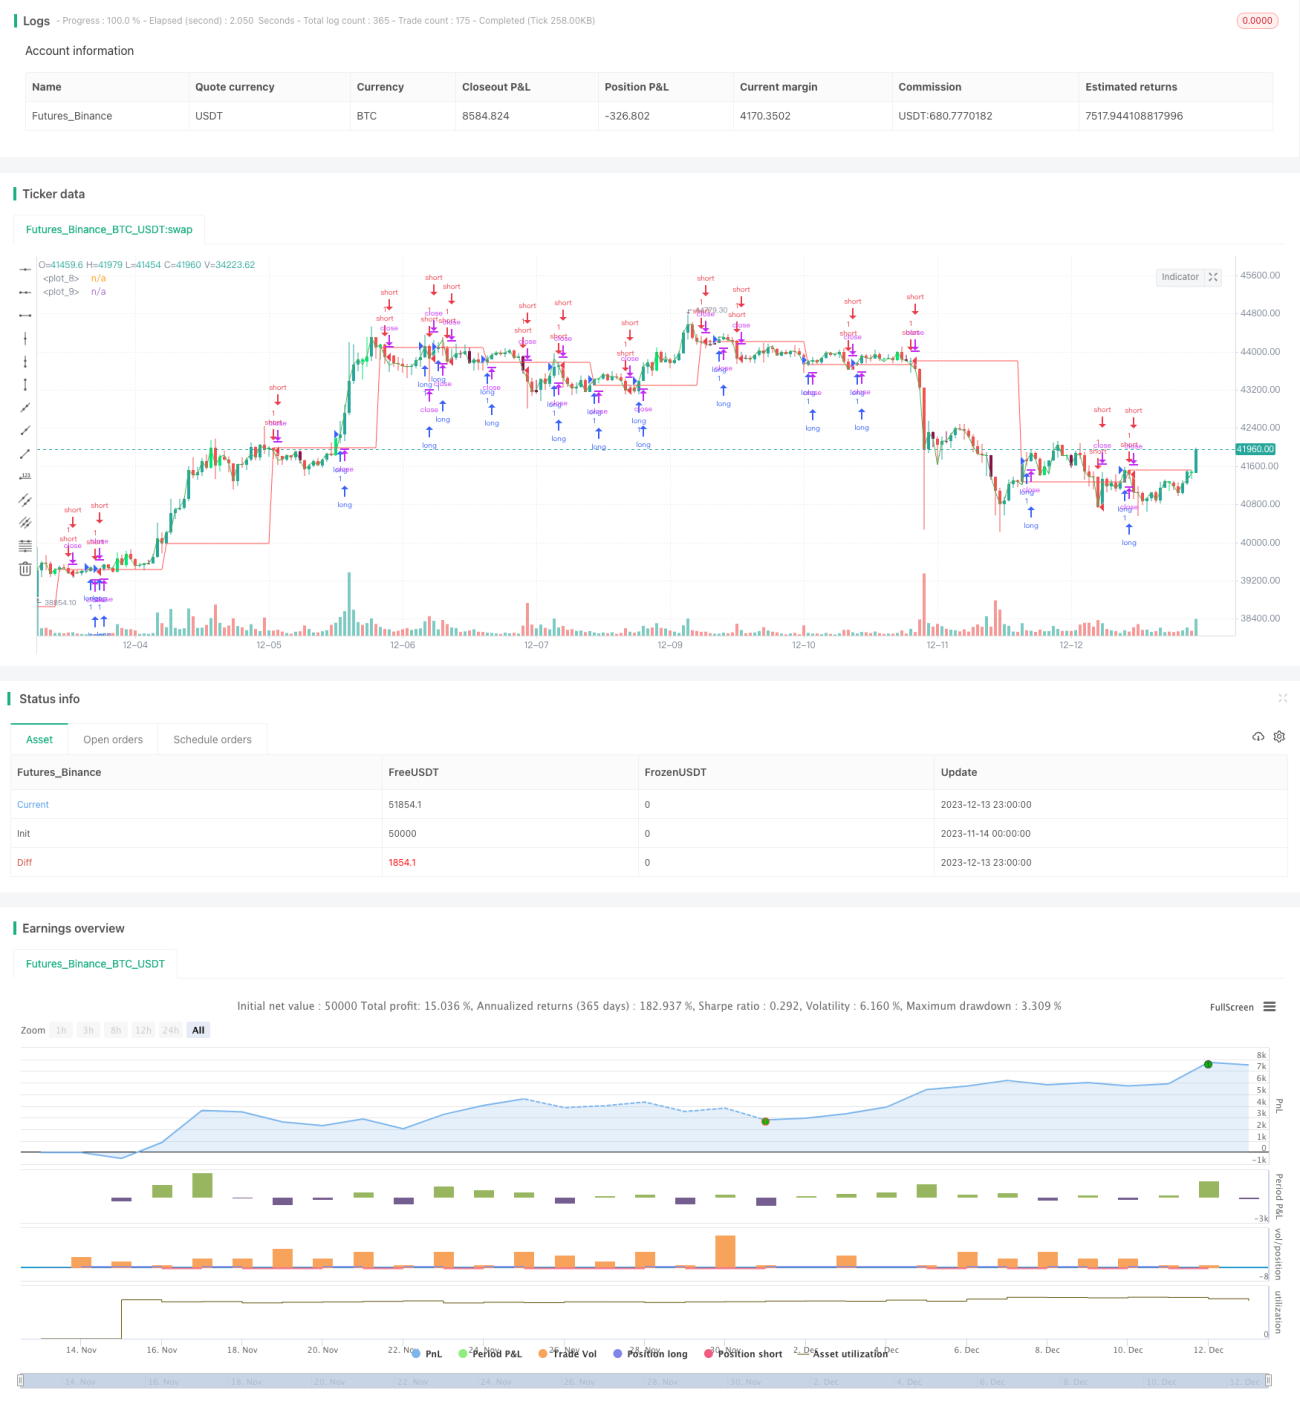
이 전략은 4시간 시간 주기 및 일계 시간 주기에서의 브레이크 신호를 결합하여 거래 신호를 발송하기 전에 K선 형태를 검증하여 더 신뢰할 수 있는 브레이크 거래 전략을 구현한다.

전략 원칙

이중 확인 돌파 전략은 짧은 주기 및 긴 주기의 돌파 신호를 조합하여, 긴 주기 트렌드 일관성을 고려한 조건에서 더 효과적인 돌파점을 식별한다. 구체적으로, 이 전략은 4 시간 및 일계 시간 주기에서 각각 평균을 계산하고, 짧은 주기의 평균이 긴 주기의 평균을 돌파할 때 구매 신호를 생성하고, 반대로 돌파는 판매 신호를 생성한다. 또한, 이 전략은 거래 신호가 발송되기 전에 현재 K 선의 형태를 점검하여, 어프싱의 K 선에 포지션을 열지 않도록 한다.

위의 이중 확인과 K선 필터링의 메커니즘을 통해, 다중 헤드 중지 또는 공허 헤드 가두기의 위험을 효과적으로 피할 수 있으며, 거래 신호의 품질을 향상시킬 수 있다.

우위 분석

  1. 이중 시간 주기 돌파는 신호 품질을 향상시킬 수 있다. 4시간과 일선의 결합으로 신호는 단기 트렌드를 추적하고 장기 트렌드를 참조하는 동시에 신호의 장점을 갖는다.

  2. K선형 검증, 오류 신호를 피할 수 있다. 신호를 발사하기 전에 검증형태를, 몇 가지 가짜 돌파를 필터링할 수 있다.

  3. 자동 최적화, 유연한 편리함. 이 전략의 돌파구 변수와 주기 변수는 사용자 정의가 가능하며, 사용자는 다른 거래 품종과 시장에 따라 최적의 변수 조합을 선택할 수 있다.

위험 분석

  1. 이중 돌파 전략은 태풍이 떨어지는 시장을 따라잡는 능력이 약하다. 단기주기와 장기주기가 동시에 급격한 시장을 볼 때, 이 전략은 가장 우수한 위치를 놓칠 수 있다.

  2. K선형 검증 메커니즘은 일부 기회를 놓칠 수 있다. 극단적인 상황에서는 K선형이 종종 왜곡되며, 검증 메커니즘은 전략을 보수하게 하여 기회를 놓치게 한다.

  3. 잘못 된 파라미터는 잘못된 신호를 발생시킨다. 사용자는 특정 품종에 따라 적절한 이중 돌파 파라미터와 K선 파라미터를 선택해야 하며, 잘못 된 파라미터는 전략 효과를 크게 저하시킬 수 있다.

위와 같은 위험에 대해, 변수 조합을 조정하고, 스톱 스톱 조건을 설정하는 등의 방법으로 개선 및 최적화 할 수 있습니다.

최적화 방향

  1. 파동률 지표와 결합하여 돌파에 대한 2차 검증을 한다. 예를 들어, 볼링거 밴드 (Bollinger Bands) 가 압축될 때 방출되는 돌파 신호는 질이 더 높다.

  2. 추가된 스톱로스 모듈. 적절한 스톱로스 설치는 수익을 잠금하고 위험을 적극적으로 회피할 수 있다.

  3. 양 돌파 파라미터를 최적화한다. 파라미터는 품종의 일내 변동률, 일선 변동률 등의 특성에 대해 조정할 수 있다.

  4. K선 검증 파라미터를 최적화한다. 다양한 주기 및 파라미터 조합의 K선 검증으로 보다 안정적인 결과를 얻을 수 있다.

요약하다

이중 확인 돌파 전략은 두 개의 시간 주기와 K 라인 형태 검증을 결합한 메커니즘을 통해 재무 효율성과 신호 품질의 효율적인 균형을 이루며, 권장되는 단선 돌파 전략이다. 사용자는 자신의 필요에 따라 관련 매개 변수를 조정하여 더 나은 효과를 얻을 수 있다.

전략 소스 코드
/*backtest
start: 2023-11-14 00:00:00
end: 2023-12-14 00:00:00
period: 1h
basePeriod: 15m
exchanges: [{"eid":"Futures_Binance","currency":"BTC_USDT"}]
*/

//@version=2
strategy("breakout ", overlay=true)
tim=input('1440')
sim=input('370')

out1 = request.security(syminfo.tickerid, tim, open)
out2 = request.security(syminfo.tickerid, sim, close)
plot(out1,color=red)
plot(out2,color=green)

length = input(20, title="BB Length")
mult = input(2.0,title="BB MultFactor")
lengthKC=input(20, title="KC Length")
multKC = input(1.5, title="KC MultFactor")

useTrueRange = input(true, title="Use TrueRange (KC)", type=bool)

// Calculate BB
source = close
basis = sma(source, length)
dev = multKC * stdev(source, length)
upperBB = basis + dev
lowerBB = basis - dev

// Calculate KC
ma = sma(source, lengthKC)
range1 = useTrueRange ? tr : (high - low)
rangema = sma(range1, lengthKC)
upperKC = ma + rangema * multKC
lowerKC = ma - rangema * multKC

sqzOn  = (lowerBB > lowerKC) and (upperBB < upperKC)
sqzOff = (lowerBB < lowerKC) and (upperBB > upperKC)
noSqz  = (sqzOn == false) and (sqzOff == false)

val = linreg(source  -  avg(avg(highest(high, lengthKC), lowest(low, lengthKC)),sma(close,lengthKC)),lengthKC,0)

bcolor = iff( val > 0,iff( val > nz(val[1]), lime, green),iff( val < nz(val[1]), red, maroon))
scolor = noSqz ? blue : sqzOn ? black : gray 
//plot(val, color=bcolor, style=histogram, linewidth=4)
//plot(0, color=scolor, style=cross, linewidth=2)

// this section based on Almost Zero Lag EMA [LazyBear]
// Fast MA - type, length
matype   = input(defval="HullMA", title="Fast MA Type: SMA, EMA, WMA, VWMA, SMMA, DEMA, TEMA, HullMA, TMA, ZEMA ( case sensitive )")
malength = input(defval=20, title="Moving Average Length", minval=1)
src      = input(close,title="Moving average Source")

// Returns MA input selection variant, default to SMA if blank or typo.
variant(type, src, len) =>
    v1 = sma(src, len)                                                  // Simple
    v2 = ema(src, len)                                                  // Exponential
    v3 = wma(src, len)                                                  // Weighted
    v4 = vwma(src, len)                                                 // Volume Weighted
    v5 = na(v5[1]) ? sma(src, len) : (v5[1] * (len - 1) + src) / len    // Smoothed
    v6 = 2 * v2 - ema(v2, len)                                          // Double Exponential
    v7 = 3 * (v2 - ema(v2, len)) + ema(ema(v2, len), len)               // Triple Exponential
    v8 = wma(2 * wma(src, len / 2) - wma(src, len), round(sqrt(len)))   // Hull
    ema1 = ema(src, len)
    ema2 = ema(ema1, len)
    v10 = ema1+(ema1-ema2)                                              // Zero Lag Exponential
    v11 = sma(sma(src,len),len)                                         // Trianglular
    // return variant, defaults to SMA if input invalid.
    type=="EMA"?v2 : type=="WMA"?v3 : type=="VWMA"?v4 : type=="SMMA"?v5 : type=="DEMA"?v6 : type=="TEMA"?v7 : type=="HullMA"?v8 : type=="ZEMA"?v10 : type=="TMA"?v11 : v1

// Calculate selected MA and get direction of trend from it.
zlema= variant(matype,src,malength)
col =  zlema > zlema[1] ? green : red
up = zlema > zlema[1] ? 1 : 0
down = zlema < zlema[1] ? 1 : 0
//plot(zlema,color=col, style=line, linewidth=4, transp=0)


// Find all Fractals.
// This section based on [RS]Fractal Levels  by RicardoSantos
hidefractals = input(false)
hidelevels = input(false)
topfractal = high[2] > high[1] and high[2] > high and high[2] > high[3] and high[2] > high[4]
botfractal = low[2] < low[1] and low[2] < low and low[2] < low[3] and low[2] < low[4]

//plotshape(hidefractals ? na : topfractal, color=green, transp=0, style=shape.triangleup, location=location.abovebar, offset=-2, size=size.tiny)
//plotshape(hidefractals ? na : botfractal, color=red, transp=0, style=shape.triangledown, location=location.belowbar, offset=-2, size=size.tiny)

topfractals = topfractal ? high[2] : topfractals[1]
botfractals = botfractal ? low[2] : botfractals[1]

topfcolor = topfractals != topfractals[1] ? na : green
botfcolor = botfractals != botfractals[1] ? na : red

//plot(hidelevels ? na : topfractals, color=topfcolor, transp=0, linewidth=2)
//plot(hidelevels ? na : botfractals, color=botfcolor, transp=0, linewidth=2)

//
// This section based on Candlestick Patterns With EMA by rmwaddelljr
//
ufb  = input(false, title="Use Fractal S/R Cross Patterns")
udc  = input(true, title="Use Dark Cloud Cover Patterns" )
upl  = input(true, title="Use Piecing Line Patterns" )
ube  = input(true, title="Use Engulfing Candle Patterns" )
ubh  = input(true, title="Use Harami Candle Patterns" )
upb  = input(true,  title="Use Defined PinBar Patterns")
pctP = input(66, minval=1, maxval=99, title="Directional PBars, % of Range of Candle the Long Wick Has To Be")
// This section based on CM_Price-Action-Bars by ChrisMoody
// Change the pin bar calculation, so can be used for market direction.
urpb= input(false, title="Use CM Price Action Reversal Pin Bars")
usb = input(false, title="Use CM Price Action Shaved Bars")
uob = input(false, title="Use CM Price Action Outside Bars")
uib = input(false, title="Use CM Price Action Inside Bars")
pctRP = input(72, minval=1, maxval=99, title="CM Reversal PBars, % of Range of Candle the Long Wick Has To Be")
pctS = input(5, minval=1, maxval=99, title="CM Shaved Bars, % of Range it Has To Close On The Lows or Highs")
pblb =input(6,minval=1,title="CM Reversal Pin Bar Lookback Length")
//
stnd = input(true, title="Alert Only Patterns Following Trend")
//
// Get MACD for Alert Filtering
umacd  = input(true,title="Alert Only Patterns Confirmed by MACD")
fastMA = input(title="MACD Fast MA Length",  defval = 12, minval = 2)
slowMA = input(title="MACD Slow MA Length",  defval = 26, minval = 7)
signal = input(title="MACD Signal Length",defval=9,minval=1)

//
sgb = input(false, title="Check Box To Turn Bars Gray")
salc = input(true, title="Show Alert condition Dot")
//
[currMacd,_,_] = macd(close[0], fastMA, slowMA, signal)
[prevMacd,_,_] = macd(close[1], fastMA, slowMA, signal)
plotColor = currMacd > 0 ? currMacd > prevMacd ? green : red : currMacd < prevMacd ? red : green

// Show alert on this bar?
sbarUp = (not umacd or plotColor == green) and (not stnd or up)
sbarDn = (not umacd or plotColor == red) and (not stnd or down)

//PBar Percentages
pctCp = pctP * .01

//Shaved Bars Percentages
pctCs = pctS * .01
pctSPO = pctCs
//ma50 = sma(close,50)

range = high - low

///Reversal PinBars
pctCRp = pctRP * .01
pctCRPO = 1 - pctCRp
//
//pBarRUp= upb and open<close and open > high - (range * pctCRPO) and close > high - (range * pctCRPO) and low <= lowest(pblb) ? 1 : 0
//pBarRDn = upb and open>close and open < high - (range *  pctCRp) and close < high-(range * pctCRp) and high >= highest(pblb) ? 1 : 0
pBarRUp = urpb and  open > high - (range * pctCRPO) and close > high - (range * pctCRPO) and low <= lowest(pblb) ? 1 : 0
pBarRDn = urpb and  open < high - (range *  pctCRp) and close < high-(range * pctCRp) and high >= highest(pblb) ? 1 : 0

//Shaved Bars filter to the MA50 line
sBarUp   = usb and (close >= (high - (range * pctCs))) // and close>ma50 
sBarDown = usb and (close <= (low + (range * pctCs)))  // and close<ma50

//Inside Bars
insideBarUp = uib and (high < high[1] and low > low[1])
insideBarDn = uib and (high < high[1] and low > low[1])
outsideBarUp= uob and (high > high[1] and low < low[1])
outsideBarDn= uob and (high > high[1] and low < low[1])

// PinBars representing possible change in trend direction
barcolor(pBarRUp ? green : na)
barcolor(pBarRDn ? red : na)

//Shaved Bars
barcolor(sBarDown ? fuchsia : na)
barcolor(sBarUp   ? aqua : na)

//Inside and Outside Bars
barcolor((insideBarUp or insideBarDn)? yellow : na )
barcolor((outsideBarUp or outsideBarDn) ? orange : na )


//Long shadow PinBars supporting market direction
///PinBars Long Upper Shadow represent selling pressure
pBarDn = upb and open < high - (range * pctCp) and close < high - (range * pctCp)
//plotshape(pBarDn and (not pBarRUp and not pBarRDn), title= "Bearish Pin Bar",  color=red, style=shape.arrowdown, text="Bearish\nPinBar")
///PinBars with Long Lower Shadow represent buying pressure
pBarUp = upb and open > low + (range * pctCp) and close > low + (range * pctCp)
//plotshape(pBarUp and (not pBarRUp and not pBarRDn),  title= "Bullish Pin Bar", location=location.belowbar, color=green, style=shape.arrowup, text="Bullish\nPinBar")

dcc = udc and (close[1]>open[1] and abs(close[1]-open[1])/range[1]>=0.7 and close<open and abs(close-open)/range>=0.7 and open>=close[1] and close>open[1] and close<((open[1]+close[1])/2))
//plotshape(dcc, title="Dark Cloud Cover",text='DarkCloud\nCover',color=red, style=shape.arrowdown,location=location.abovebar)
ts = timestamp(2021,8,1,8,18)
pln= upl and (close[1]<open[1] and abs(open[1]-close[1])/range[1]>=0.7 and close>open and abs(close-open)/range>=0.7 and open<=close[1] and close<open[1] and close>((open[1]+close[1])/2))
//plotshape(pln, title="Piercieng Line",text="Piercing\nLine",color=green, style=shape.arrowup,location=location.belowbar)

beh = ubh and (close[1] > open[1] and open > close and open <= close[1] and low >= open[1] and open - close < close[1] - open[1] and (high < high[1] and low > low[1]))
//plotshape(beh and not dcc, title= "Bearish Harami",  color=red, style=shape.arrowdown, text="Bear\nHarami")

blh = ubh and (open[1] > close[1] and close > open and close <= open[1] and high <= open[1] and close - open < open[1] - close[1] and (high < high[1] and low > low[1]))
//plotshape(blh and not pln,  title= "Bullish Harami", location=location.belowbar, color=green, style=shape.arrowup, text="Bull\nHarami")

bee = ube and (close[1] > open[1] and close < open and close<=low[1] and open>= close[1])
//plotshape(bee,  title= "Bearish Engulfing", color=red, style=shape.arrowdown, text="Bearish\nEngulf")

ble = ube and (close[1] < open[1] and close > open and close >= high[1] and open<=close[1])
//plotshape(ble, title= "Bullish Engulfing", location=location.belowbar, color=green, style=shape.arrowup, text="Bullish\nEngulf")

blfr = ufb and crossover(close,topfractals)
//plotshape(blfr and not ble and not blh and not sBarUp, title= "Bullish Fractal Cross", location=location.belowbar, color=green, style=shape.arrowup, text="Fractal\nCross")
befr = ufb and crossunder(close,botfractals) 
//plotshape(befr and not bee and not beh and not sBarDown,  title= "Bearish Fractal Cross", color=red, style=shape.arrowdown, text="Fractal\nCross")
//
//
bcolorDn = sbarDn and not(pBarRDn or pBarRUp or sBarDown or insideBarDn or outsideBarDn) and (beh or bee or dcc or befr or pBarDn)
bcolorUp = sbarUp and not(pBarRDn or pBarRUp or sBarUp or insideBarUp or outsideBarUp) and (blh or ble or pln or blfr or pBarUp)
barcolor(bcolorDn ? maroon : na)
barcolor(bcolorUp ? lime : na)
//
barcolor(sgb and close ? gray : na)

bullcnd = pBarUp or pln or blh or ble or blfr
bearcnd = pBarDn or dcc or beh or bee or befr
if(true )
    longCondition = crossover(out2,out1)
    if(longCondition or close > out1 and bullcnd and strategy.position_size == 0)
        strategy.entry("long", strategy.long)
    
    //if (pBarRUp) // and bullcnd) //and strategy.position_size == 0)
    //    strategy.entry("long", strategy.long)
        
    shortCondition = crossunder(out2,out1)
    if (shortCondition or close < out1 and bearcnd and strategy.position_size == 0)
        strategy.entry("short", strategy.short)

//
barAlertDn = (sbarDn and (befr or bee or beh or pBarDn  or dcc)) or (sbarDn and (insideBarDn or outsideBarDn or sBarDown)) or pBarRDn
barAlertUp = (sbarUp and (blfr or ble or blh or pBarUp  or pln)) or (sbarUp and (insideBarUp or outsideBarUp or sBarUp))  or pBarRUp
barAlert = barAlertDn or barAlertUp
alertcondition(barAlert,title="CDLTRD Alert", message="CDLTRD Bar Alert")
// show only when alert condition is met and bar closed.
//plotshape(salc and barAlert[1],title= "Alert Indicator Closed", location=location.bottom, color=barAlertDn[1]?red:green, transp=0, style=shape.circle,offset=-1)
//EOF


    //if (pBarRDn) //and bearcnd//and strategy.position_size == 0)
     //   strategy.entry("short", strategy.short)

//strategy.close("long", when = exit)        
//strategy.close("short", when = exit2)
    
    
//exit3 = sqzOn and sqzOn[1] and sqzOn[2] and sqzOn[3] and sqzOn[4] and sqzOn[5] and sqzOn[6]
//strategy.close("long", when = exit3)
//strategy.close("short", when = exit3)
    
    
//else
  //  alertcondition(condition = time > t, message = "Time exceeded")