더블 이동 평균 3개 지수 지표 거래 전략

개요
이 전략은 쌍평선 지표와 삼진평선 지표를 사용하여 무작위 지표와 결합하여 안정적이고 신뢰할 수있는 추세를 추적하는 거래 전략을 형성합니다. 주요 아이디어는 평선 지표 판단이 금 포크 또는 사다리 발생하면 거래 신호를 발산하는 것입니다. 무작위 지표는 과매도 과매도 상황을 판단하는 데 보조적으로 사용되며 시장의 급격한 변동이있을 때 잘못된 신호를 발생하지 않습니다.
원칙
이 전략은 크게 4가지로 구성되어 있습니다.
-
쌍평선 지표: 각각 50주기 및 100주기 지수 이동 평균 ((EMA) 을 계산하여, 단기 EMA 상에서 장기 EMA를 통과하면 구매 신호를 생성하고, 하위 EMA를 통과하면 판매 신호를 생성한다.
-
3개의 지수 지수: 50주기, 100주기, 200주기 각각의 지수 이동 평균을 계산하여 시장 추세 방향을 판단하기 위해. 50EMA>100EMA>200EMA가 다목시장이고, 50EMA<100EMA<200EMA가 공목시장이다.
-
무작위 지표: RSI의 6일 K값과 D값을 계산하여 오버 바이 오버 소드를 판단한다. D값을 K값 위에 통과하면 오버 소드, D값을 아래로 통과하면 오버 바이이다.
-
거래 신호: 쌍평평선 지표가 신호를 생성하는 동시에 시장이 3 지수평선 다단 또는 공백 상태에 부합하며, 무작위 지표가 오버 바이 오버 세를 표시하지 않을 때 진정한 거래 지시가 발령됩니다.
장점
이 전략은 평균선 지표와 무작위 지표의 장점을 통합하여 거래 신호를 발송 할 때 트렌드 방향을 고려하고 시장의 과매매 상태를 참고하여 소음을 잘 필터링하여 명확한 추세를 추적 할 수 있습니다. 또한, 전체적인 추세를 판단하기 위해 3 개의 지수 평균선을 사용하여 신호를 더 신뢰할 수 있습니다. 이 전략은 간단하고 이해하기 쉽고 실행 할 수 있으며 최적화 할 수 있습니다.
위험과 대책
이 전략의 가장 큰 위험은 지표 판단에 의존한다는 점이며, 지표가 잘못된 신호를 내면 거래 실패로 이어질 수 있다. 또한, 더 긴 주기 평균 지표를 사용하여 전체적인 추세를 판단할 때, 단기 기회도 놓칠 수 있다. 주요 위험 대책은 다음과 같다:
-
지표 파라미터를 최적화하고, 쌍평균선과 삼진평균선의 주기적 조합을 조정하여 시장 특성에 더 잘 맞게 만듭니다.
-
더 많은 지표와 결합하여 CANCEL 작업을 수행하고, 시장의 급격한 변동이 있다고 판단되면 현재 거래를 중단합니다.
-
단선 다단계 전략에 보조하여, 장선 다단계 시장에서 단기 기회를 활용하여 수익을 창출하십시오.
최적화 방향
이 전략은 다음의 몇 가지 측면에서 최적화될 수 있습니다.
-
이중 평균선과 3 지수 평균선의 주기 변수를 조정하고, 시장 특성에 따른 지표를 최적화한다.
-
VOLUME 및 MACD와 같은 지표 판단을 증가시켜 가격 이상으로 인해 잘못된 신호가 발생하지 않도록하십시오.
-
촛불 모드를 사용하여 트렌드를 확인하고, 단기 철회 후의 잘못된 신호를 피하십시오.
-
주식, 외환 등으로 확장하여 전략의 적합성을 테스트하십시오.
-
VIX 지표와 결합하여 전체 시장의 변동성을 판단하고 포지션 규모를 제어한다.
요약하다
이 전략은 쌍평선 지표를 사용하여 거래 신호를 발산하고, 삼진평선 및 무작위 지표를 보조 판단으로 사용하여 안정적인 트렌드 추적 전략을 구축합니다. 그것은 이해하기 쉽고, 실행하기 쉽고, 시장 특성에 대한 일치도가 높고, 수익이 안정적입니다. 권장되는 정량화 전략입니다.
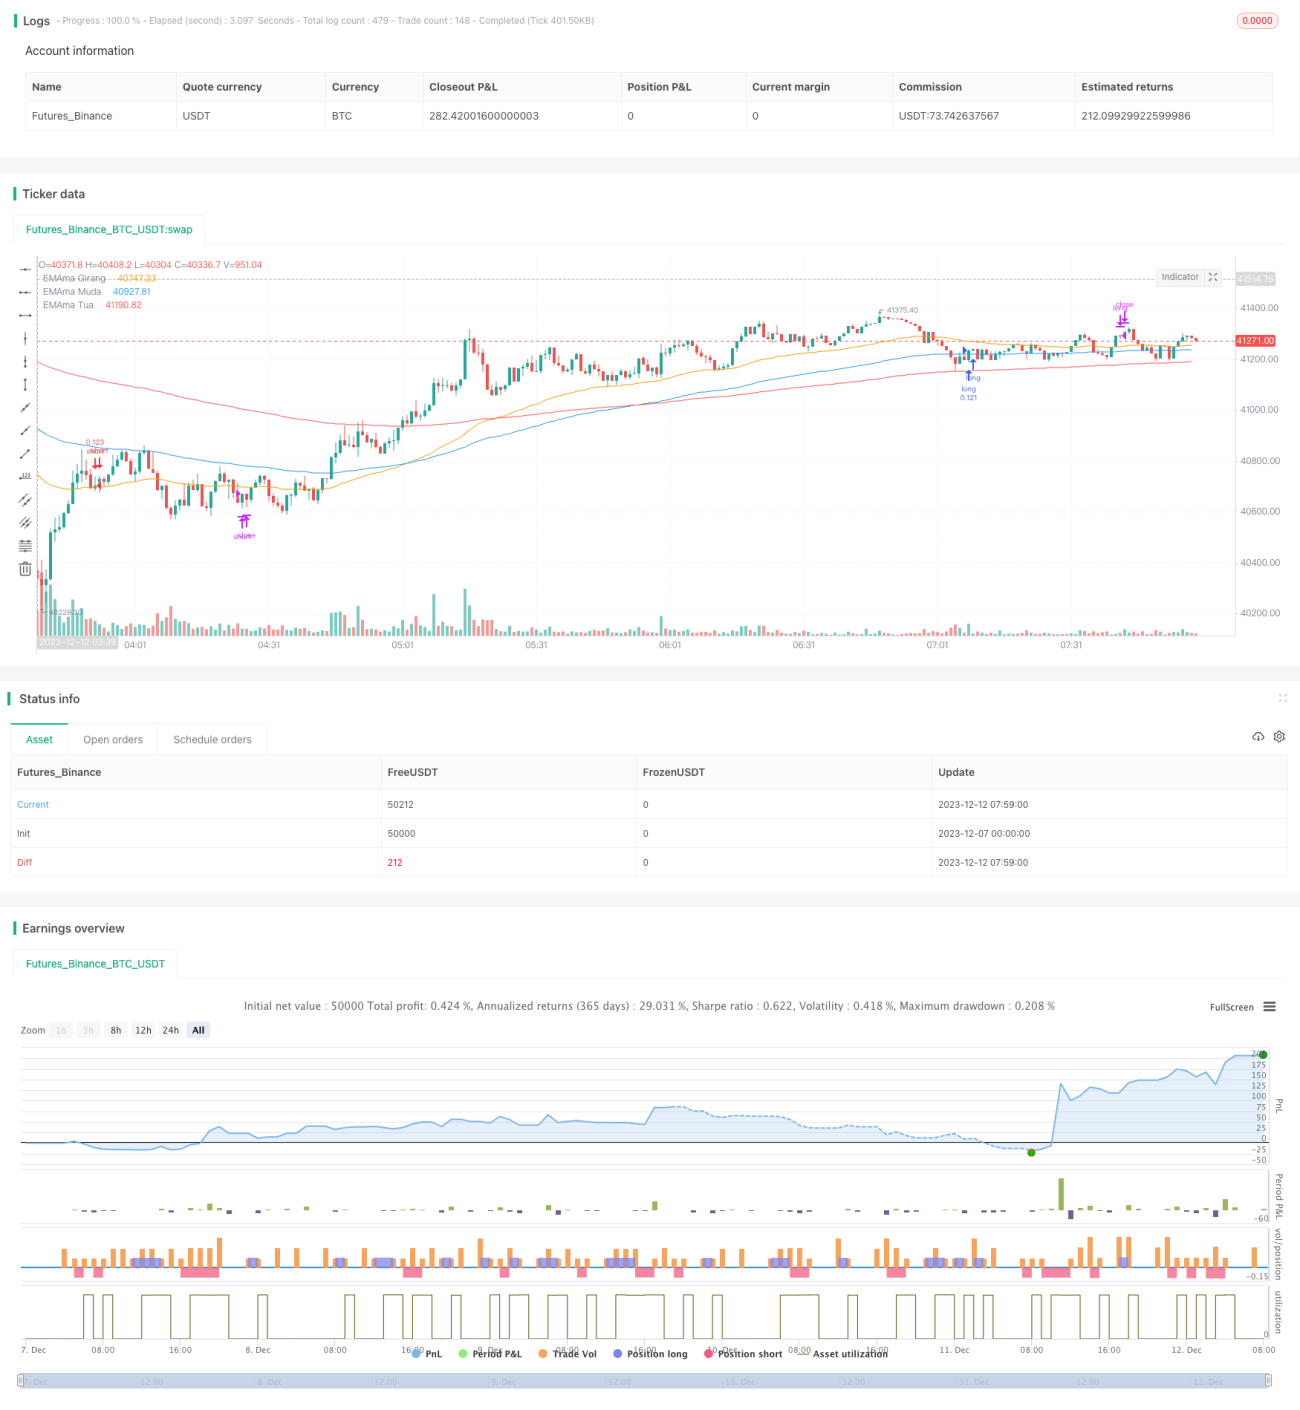
/*backtest
start: 2023-12-07 00:00:00
end: 2023-12-12 08:00:00
period: 1m
basePeriod: 1m
exchanges: [{"eid":"Futures_Binance","currency":"BTC_USDT"}]
*/

//@version=5
strategy(title='5212 EMA Strategy', shorttitle='5212 EMA', overlay=true, pyramiding=0, default_qty_type=strategy.percent_of_equity, default_qty_value=10, calc_on_every_tick=false)

//**Backtest Date sof- 1