MACD 지표를 기반으로 한 이중 이동 평균 거래 전략

1
Follow
1778
Followers
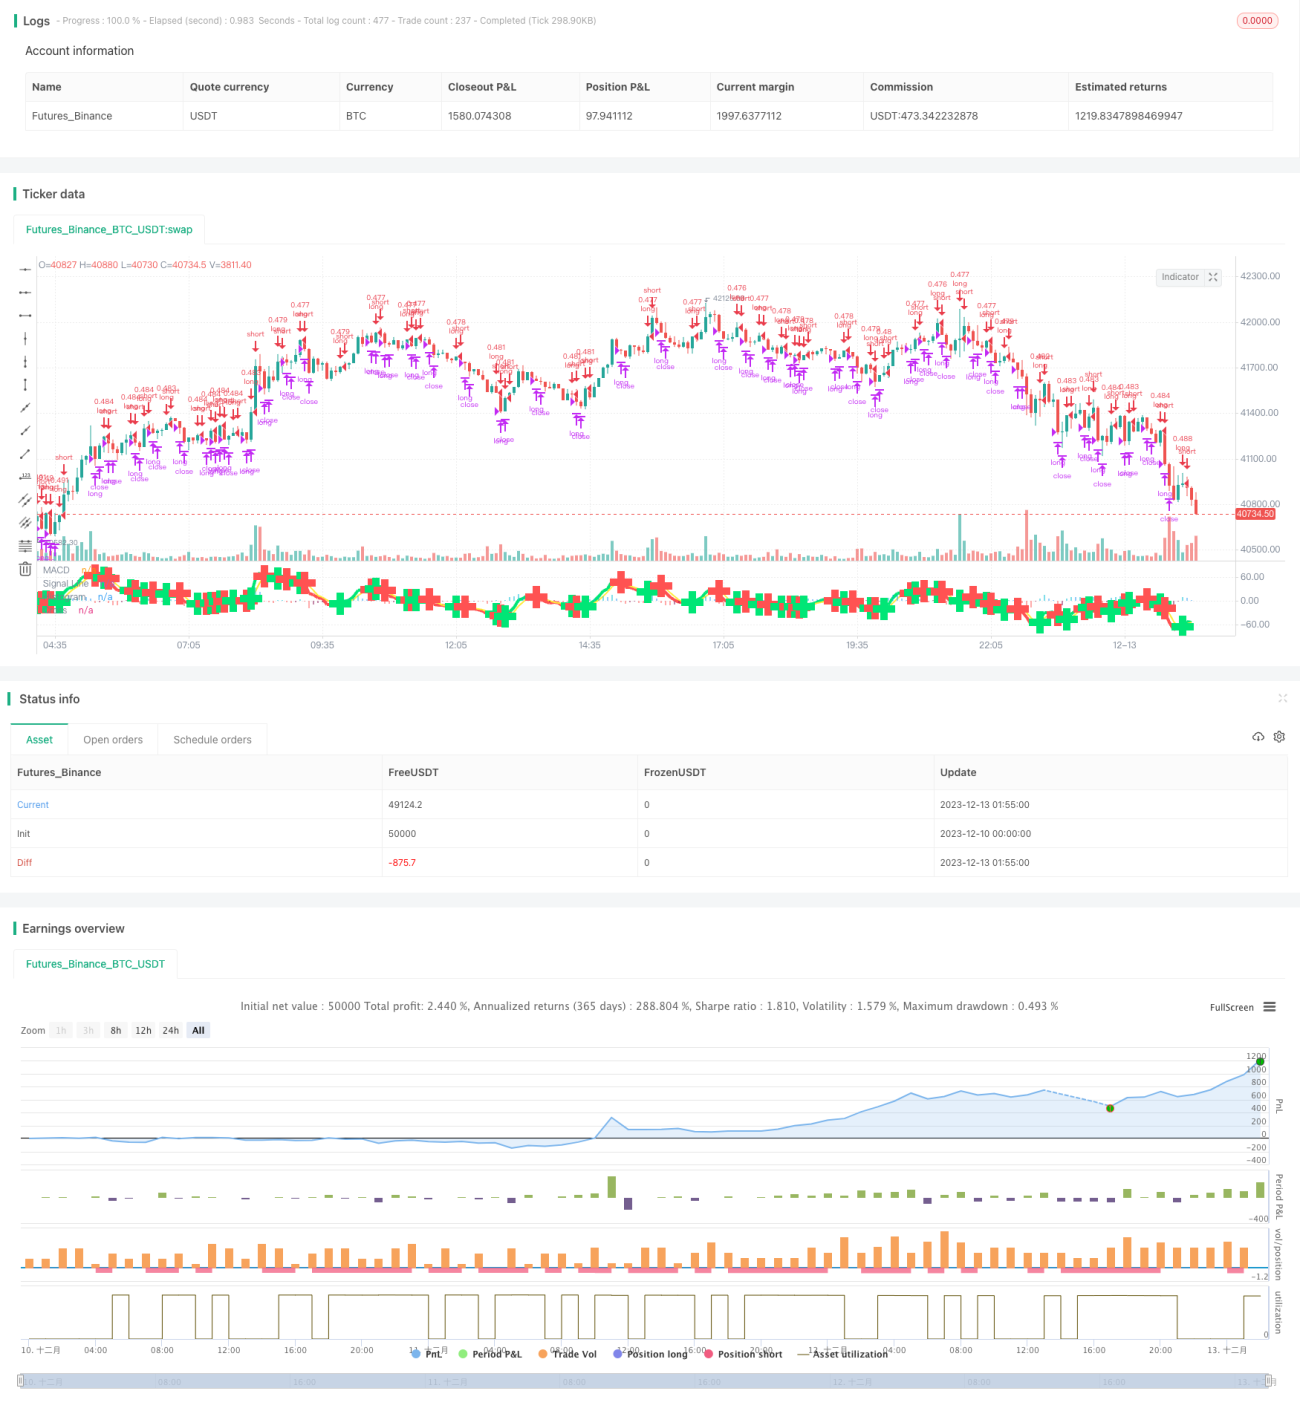
개요
이 전략은MACD 쌍평평선 추적 전략MACD 지표의 쌍평평선 금叉死叉를 거래 신호로 사용하고, 어제의 최저 가격과 결합하여 스톱로스 포인트로, 주식 가격의 짧은 선의 움직임을 추적한다.
전략 원칙
- 계산 빠른 라인 EMA ((close, 5), 느린 라인 EMA ((close, 8), 신호 라인 SMA ((MACD, 3)
- 다중 헤드 신호를 정의: 빠른 선에서 느린 선을 통과할 때 더 많이 한다
- 공백 신호를 정의합니다: 빠른 라인 아래에서 느린 라인을 뚫거나 하루의 종료 가격이 어제의 최저 가격보다 낮을 때 공백합니다.
- 지분액은 초기 자본 2000달러로 종식 가격으로 나<unk>다.
- 다중 헤드 중지 공허 헤드 신호 평축
우위 분석
- MACD 지표를 사용하여 시장의 과매매 지역을 판단하고, 쌍평평선과 함께 거래 신호를 형성하여 가짜 돌파구를 피하십시오.
- 단기 트렌드를 추적하고 적시에 손실을 막는 것
- 지분량 동적으로 조정하여 단일 손실을 피하십시오.
위험 분석
- MACDIndicator가 지연되어서 단선 기회를 놓칠 수 있습니다.
- 쌍방향 거래 신호는 가짜 신호를 생성할 수 있다.
- 스톱포인트가 너무 급진적이기 때문에 과도하게 자주 스톱포인트가 발생할 수 있습니다.
최적화 방향
- MACD 변수 모음을 최적화하여 지표의 감수성을 향상시킵니다.
- 트렌드 판단을 높이고, 흔들리는 시장에서 발생하는 잘못된 신호를 피하십시오.
- 변동성 지수와 함께 시장의 변동성을 평가하고, 스톱포드를 조정합니다.
요약하다
이 전략은 고전적인 MACD 쌍평평선 조합 지표를 사용하여 오버 바이 오버 소드 범위를 판단하고 거래 신호를 생성하며 동적 포지션 수량과 전날 최저 가격의 스톱 로스 포인트 디자인을 도입하여 주식 가격의 짧은 선의 변동 특성을 포착합니다. 전체 전략 아이디어는 명확하고 이해하기 쉽습니다. 추가 테스트 및 최적화를 할 가치가 있습니다.
Source
Pine
/*backtest
start: 2023-12-10 00:00:00
end: 2023-12-13 02:00:00
period: 5m
basePeriod: 1m
exchanges: [{"eid":"Futures_Binance","currency":"BTC_USDT"}]
*/

//@version=2
// macd/cam v1 strategizing Chris Moody Macd indicator https://www.tradingview.com/script/OQx7vju0-MacD-Custom-Indicator-Multiple-Time-Frame-All-Available-Options/
// macd/cam v2 changing to macd 5,8,3
// macd/cam v2.1 Strategy parameters
Related strategies
Comment
All comments (0)
No data
- 1