개요
이 전략은 부린 라인을 상대적으로 약한 지표 (RSI) 와 결합하여 RSI 지표가 초과 초과되는 동안 부린 라인의 상하 궤도를 돌파하는 것이 필요합니다. 이것은 이 전략의 거래 신호를 더욱 엄격하고 신뢰할 수있게 만듭니다.
전략 원칙
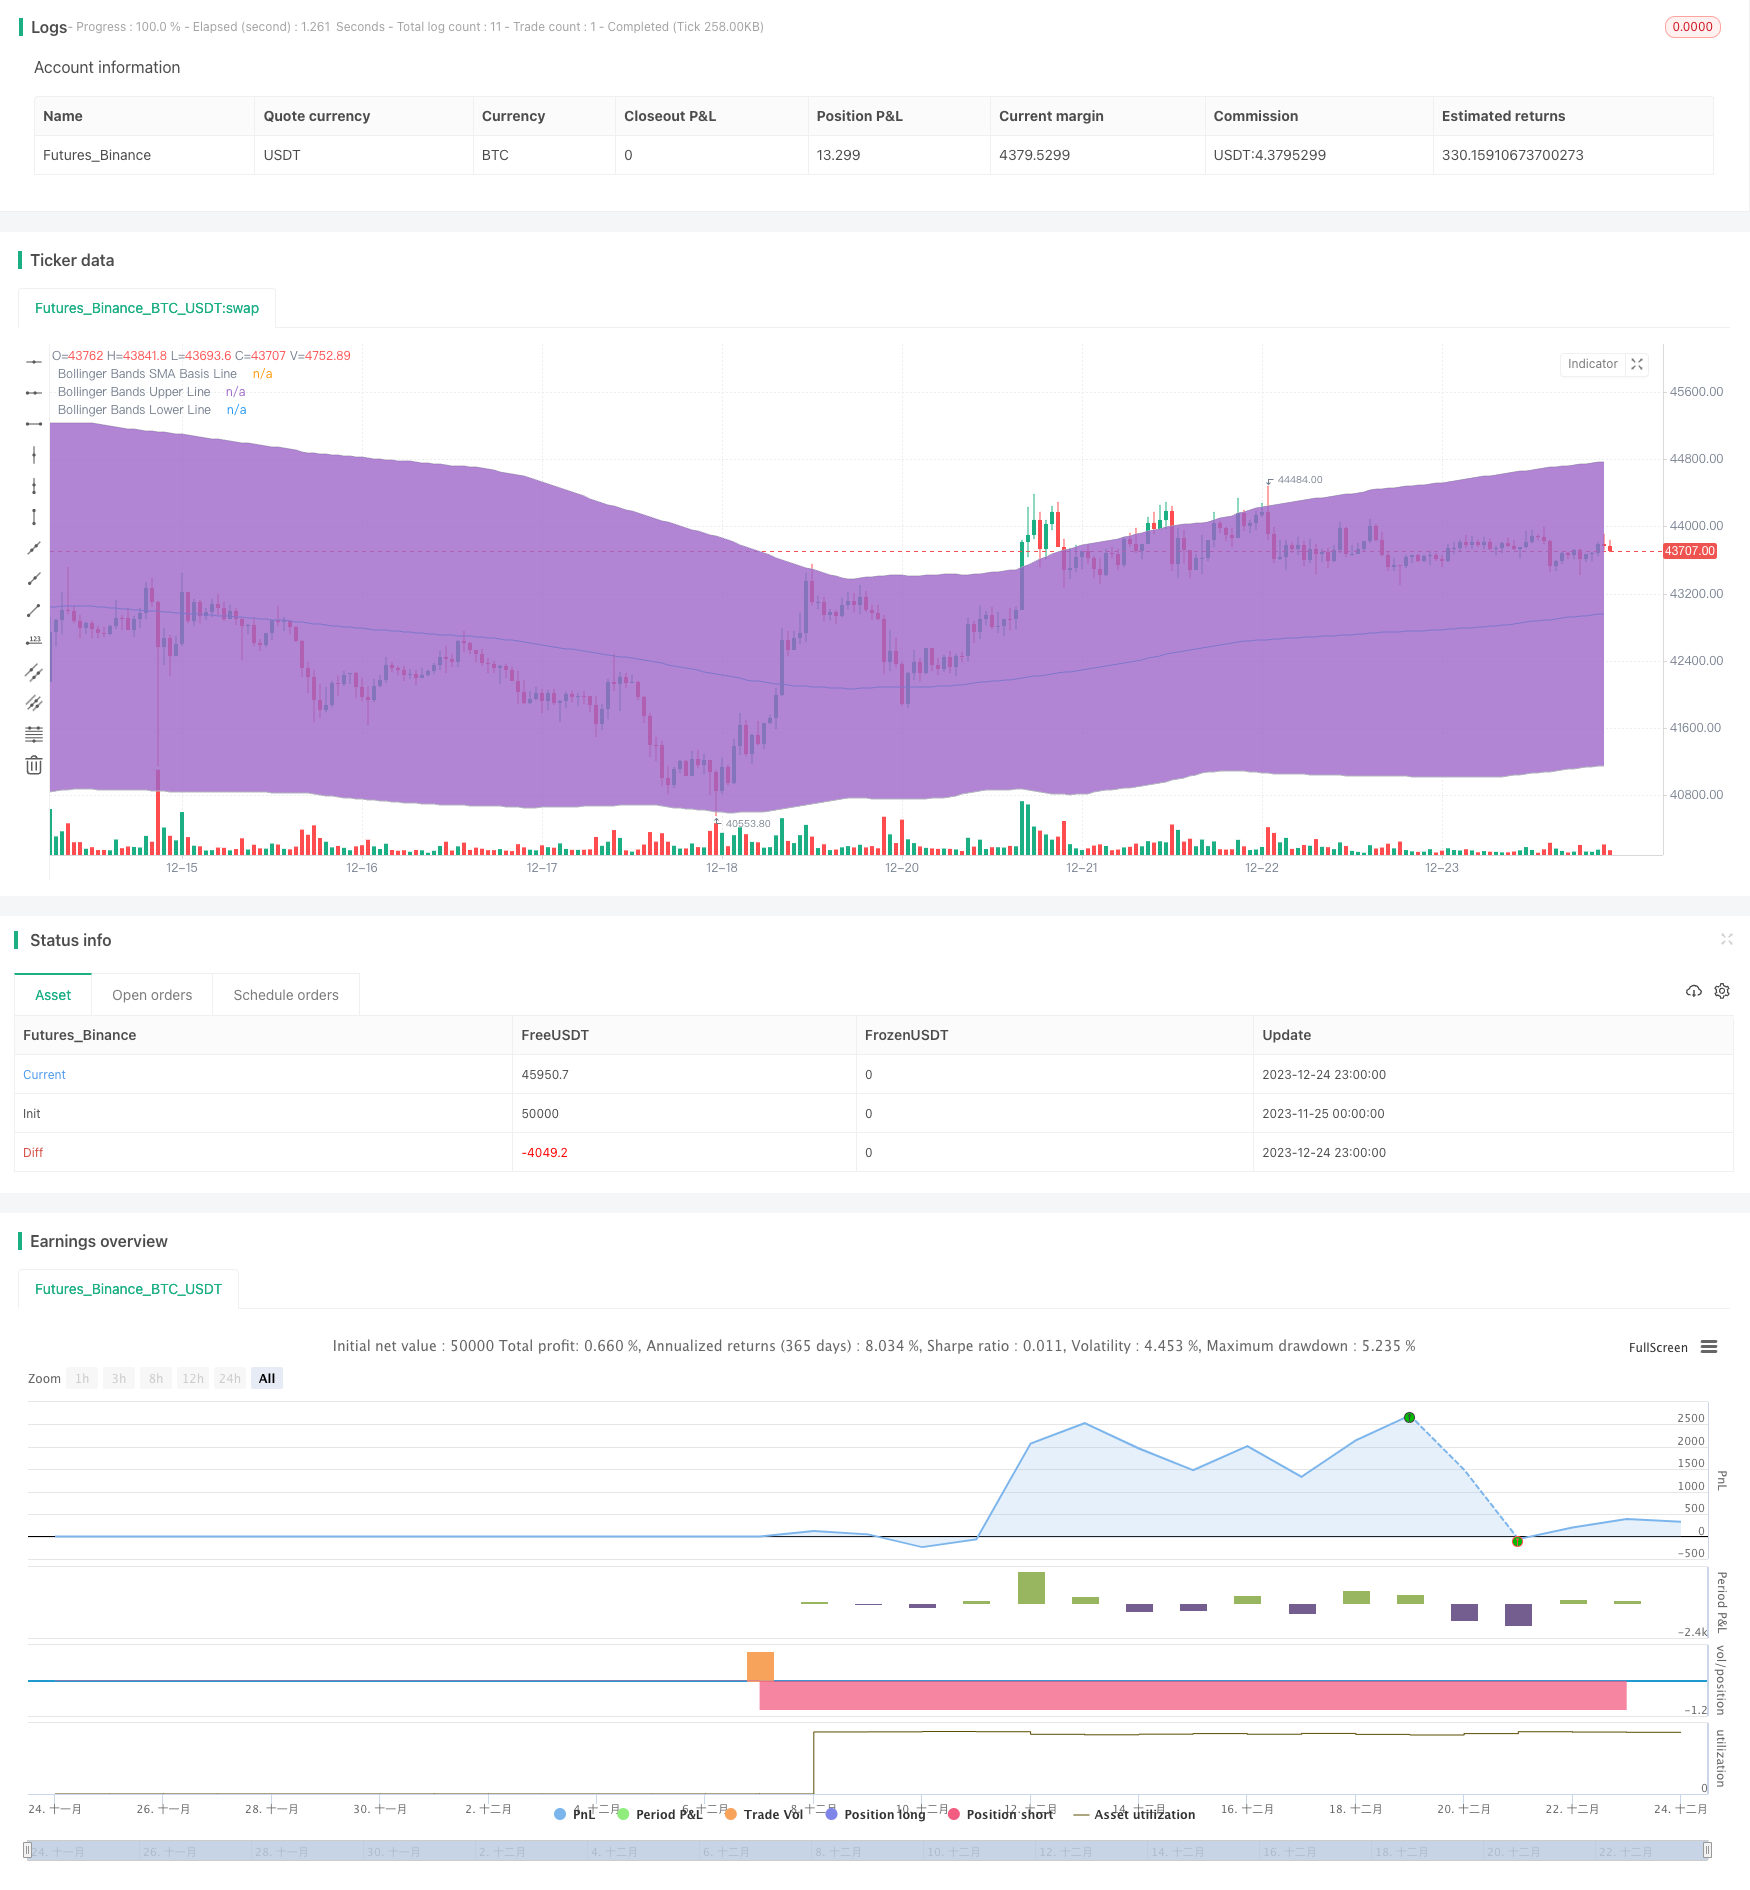
- 브린 라인을 사용하여, 이전 n 일간의 종식 가격에 따라 중간 라인, 상단 라인 및 하단 라인을 계산한다.
- RSI를 계산하여 시장이 지나치게 부진했거나 부진했는지를 판단한다.
- RSI 지표가 오버보우트 (rsi_overbought 변수보다 높다) 를 표시하고 가격이 부린 라인을 돌파했을 때만 포스트 거래를하십시오.
- RSI 지표가 오버솔드 (rsi_oversold 변수보다 낮게) 를 표시하고 가격이 브린의 하위 경로를 돌파했을 때만 다중 거래하십시오.
이 전략은 부린 라인의 통로 특성과 RSI 지표의 오버 바이 오버 셀 신호를 동시에 활용하여 단일 지표의 판단 오류를 피하고 더 신뢰할 수 있습니다.
전략적 이점
- 브린라인과 RSI 지표의 장점을 종합적으로 활용하여 판단을 더 엄격하게하고 실수를 피하십시오.
- 브린 라인은 동적 통로를 설정하여 시장의 변동 법칙을 파악할 수 있다.
- RSI는 과매매를 판단하고, 하락을 추격하는 것을 피한다.
전략적 위험
- 브린 라인 파라미터가 잘못 설정되면 상하 레일은 가격을 효과적으로 포괄할 수 없다.
- RSI 파라미터를 잘못 설정하면 실제 초고매를 판단할 수 없다.
- 전략 자체로는 트렌드 방향을 판단할 수 없으며, 다른 지표와 함께 사용해야 합니다.
위와 같은 위험들에 대응하여, 변수를 최적화하고, 모델을 엄격하게 테스트하고, 다른 지표들을 통해 큰 추세를 판단해야 한다.
전략 최적화 방향
- 다양한 주기 변수의 브린 라인을 테스트하여 최적의 주기 변수를 찾습니다.
- 다른 변수 RSI 지표를 테스트하여 우수한 변수를 결정합니다.
- 이동 평균과 같은 다른 지표가 추가될 수 있습니다.
요약하다
이 전략은 브린라인과 RSI 지표의 장점을 성공적으로 결합하여 두 가지 신호가 동시에 발생했을 때 거래 지시를 발령하여 단일 지표 판단 오류를 효과적으로 방지하여 거래를 더 신뢰할 수 있습니다. 동시에, 변수를 최적화하고, 엄격하게 테스트하고, 다른 지표에 의해 큰 흐름을 판단하여 전략의 안정성과 수익률을 더욱 향상시킵니다.
전략 소스 코드
/*backtest
start: 2023-11-25 00:00:00
end: 2023-12-25 00:00:00
period: 1h
basePeriod: 15m
exchanges: [{"eid":"Futures_Binance","currency":"BTC_USDT"}]
*/

//@version=2
strategy("Bollinger + RSI, Double Strategy (by ChartArt) v1.1", shorttitle="CA_-_RSI_Bol_Strat_1.1", overlay=true)

// ChartArt's RSI + Bollinger Bands, Double Strategy - Update
//
// Version 1.1
// Idea by ChartArt on January 18, 2015.
//
// This strategy uses the RSI indicator
// together with the Bollinger Bands
// to sell when the price is above the
// upper Bollinger Band (and to buy when
// this value is below the lower band).
//
// This simple strategy only triggers when
// both the RSI and the Bollinger Bands
// indicators are at the same time in
// a overbought or oversold condition.
//
// In this version 1.1 the strategy was
// both simplified for the user and
// made more successful in backtesting.
//
// List of my work:
// https://www.tradingview.com/u/ChartArt/
//
//  __             __  ___       __  ___
// /  ` |__|  /\  |__)  |   /\  |__)  |
// \__, |  | /~~\ |  \  |  /~~\ |  \  |
//
//


///////////// RSI
RSIlength = input(6,title="RSI Period Length")
RSIoverSold = 50
RSIoverBought = 50
price = close
vrsi = rsi(price, RSIlength)


///////////// Bollinger Bands
BBlength = input(200, minval=1,title="Bollinger Period Length")
BBmult = 2 // input(2.0, minval=0.001, maxval=50,title="Bollinger Bands Standard Deviation")
BBbasis = sma(price, BBlength)
BBdev = BBmult * stdev(price, BBlength)
BBupper = BBbasis + BBdev
BBlower = BBbasis - BBdev
source = close
buyEntry = crossover(source, BBlower)
sellEntry = crossunder(source, BBupper)
plot(BBbasis, color=aqua,title="Bollinger Bands SMA Basis Line")
p1 = plot(BBupper, color=silver,title="Bollinger Bands Upper Line")
p2 = plot(BBlower, color=silver,title="Bollinger Bands Lower Line")
fill(p1, p2)


///////////// Colors
switch1=input(true, title="Enable Bar Color?")
switch2=input(true, title="Enable Background Color?")
TrendColor = RSIoverBought and (price[1] > BBupper and price < BBupper) and BBbasis < BBbasis[1] ? red : RSIoverSold and (price[1] < BBlower and price > BBlower) and BBbasis > BBbasis[1] ? green : na
barcolor(switch1?TrendColor:na)
bgcolor(switch2?TrendColor:na,transp=50)


///////////// RSI + Bollinger Bands Strategy
if (not na(vrsi))

    if (crossover(vrsi, RSIoverSold) and crossover(source, BBlower))
        strategy.entry("RSI_BB_L", strategy.long, stop=BBlower,  comment="RSI_BB_L")
    else
        strategy.cancel(id="RSI_BB_L")

    if (crossunder(vrsi, RSIoverBought) and crossunder(source, BBupper))
        strategy.entry("RSI_BB_S", strategy.short, stop=BBupper,  comment="RSI_BB_S")
    else
        strategy.cancel(id="RSI_BB_S")

//plot(strategy.equity, title="equity", color=red, linewidth=2, style=areabr)