개요
고정 롤링 CVDVWAP에 기반한 신호 전략은 TradingView 플랫폼에서 설계된 복잡한 기술 분석 지표이다. 그것은 거래의 진입 및 퇴출 신호를 생성하기 위해 고정 롤링 VWAP, 누적 롤링 CVD 및 표준 차차 분석의 개념을 통합한다.
전략 원칙
이 전략의 핵심은 고정된 VWAP를 계산하는 것입니다. 즉, 특정 고정 기둥 에서 VWAP를 계산하는 것입니다. 이 고정 기둥은 사용자 정의 한 주기에 거래량이 가장 많은 기둥입니다. 그리고 이 고정된 VWAP에 따라 표준 차원에서 계산된 패키지 띠를 그리며 과매도 지역을 반영합니다. 가격의 변화율과 함께 ROC 지표는 의 하락과 상승을 감지합니다.
전략적 이점
- 거래량 가중 평균 가격을 이용한 가격 판단의 가치 영역과 지지/저항 지점
- 표준 불량망이 고조선 가격으로 초고매가 된 상황
- CVD 거래량 지표는 매매 압박을 나타냅니다.
- 명확한 입출소 신호점
- 자동으로 중지 및 중지 수준을 설정하여 위험 관리를 지원합니다.
위험 분석
- 잘못된 매개 변수 설정은 놓친 거래 기회를 초래하거나 유효하지 않은 신호를 생성할 수 있습니다.
- 단독으로 사용할 수 없는 더 많은 지표와 함께 의사결정을 해야 합니다.
- 다양한 품종과 주기에 맞게 적절하게 최적화 된 매개 변수 필요
- 정지 손실과 정지 위치를 잘못 설정하면 큰 손실이 발생할 수 있습니다.
최적화 방향
- VWAP를 계산하는 고정 기둥 선택 논리를 조정합니다.
- 다른 표준 차등 배수 설정을 시도합니다.
- 품종의 변동률 특성에 맞게 ROC의 변수를 최적화
- 시장의 급격한 변동에 대응하기 위해 동적 미끄러지점이나 적응성 스톱을 설정합니다.
요약하다
고정 롤링 CVDVWAP의 신호 전략을 기반으로 여러 지표를 종합적으로 사용하여 가격 움직임을 판단하고 매매 힘을 판단하는 것은 거래 기회를 발견하는 데 도움이 됩니다. 그러나 신중하게 사용해야하며 자신의 거래 전략에 맞게 지속적으로 테스트하고 최적화해야합니다.
전략 소스 코드
/*backtest
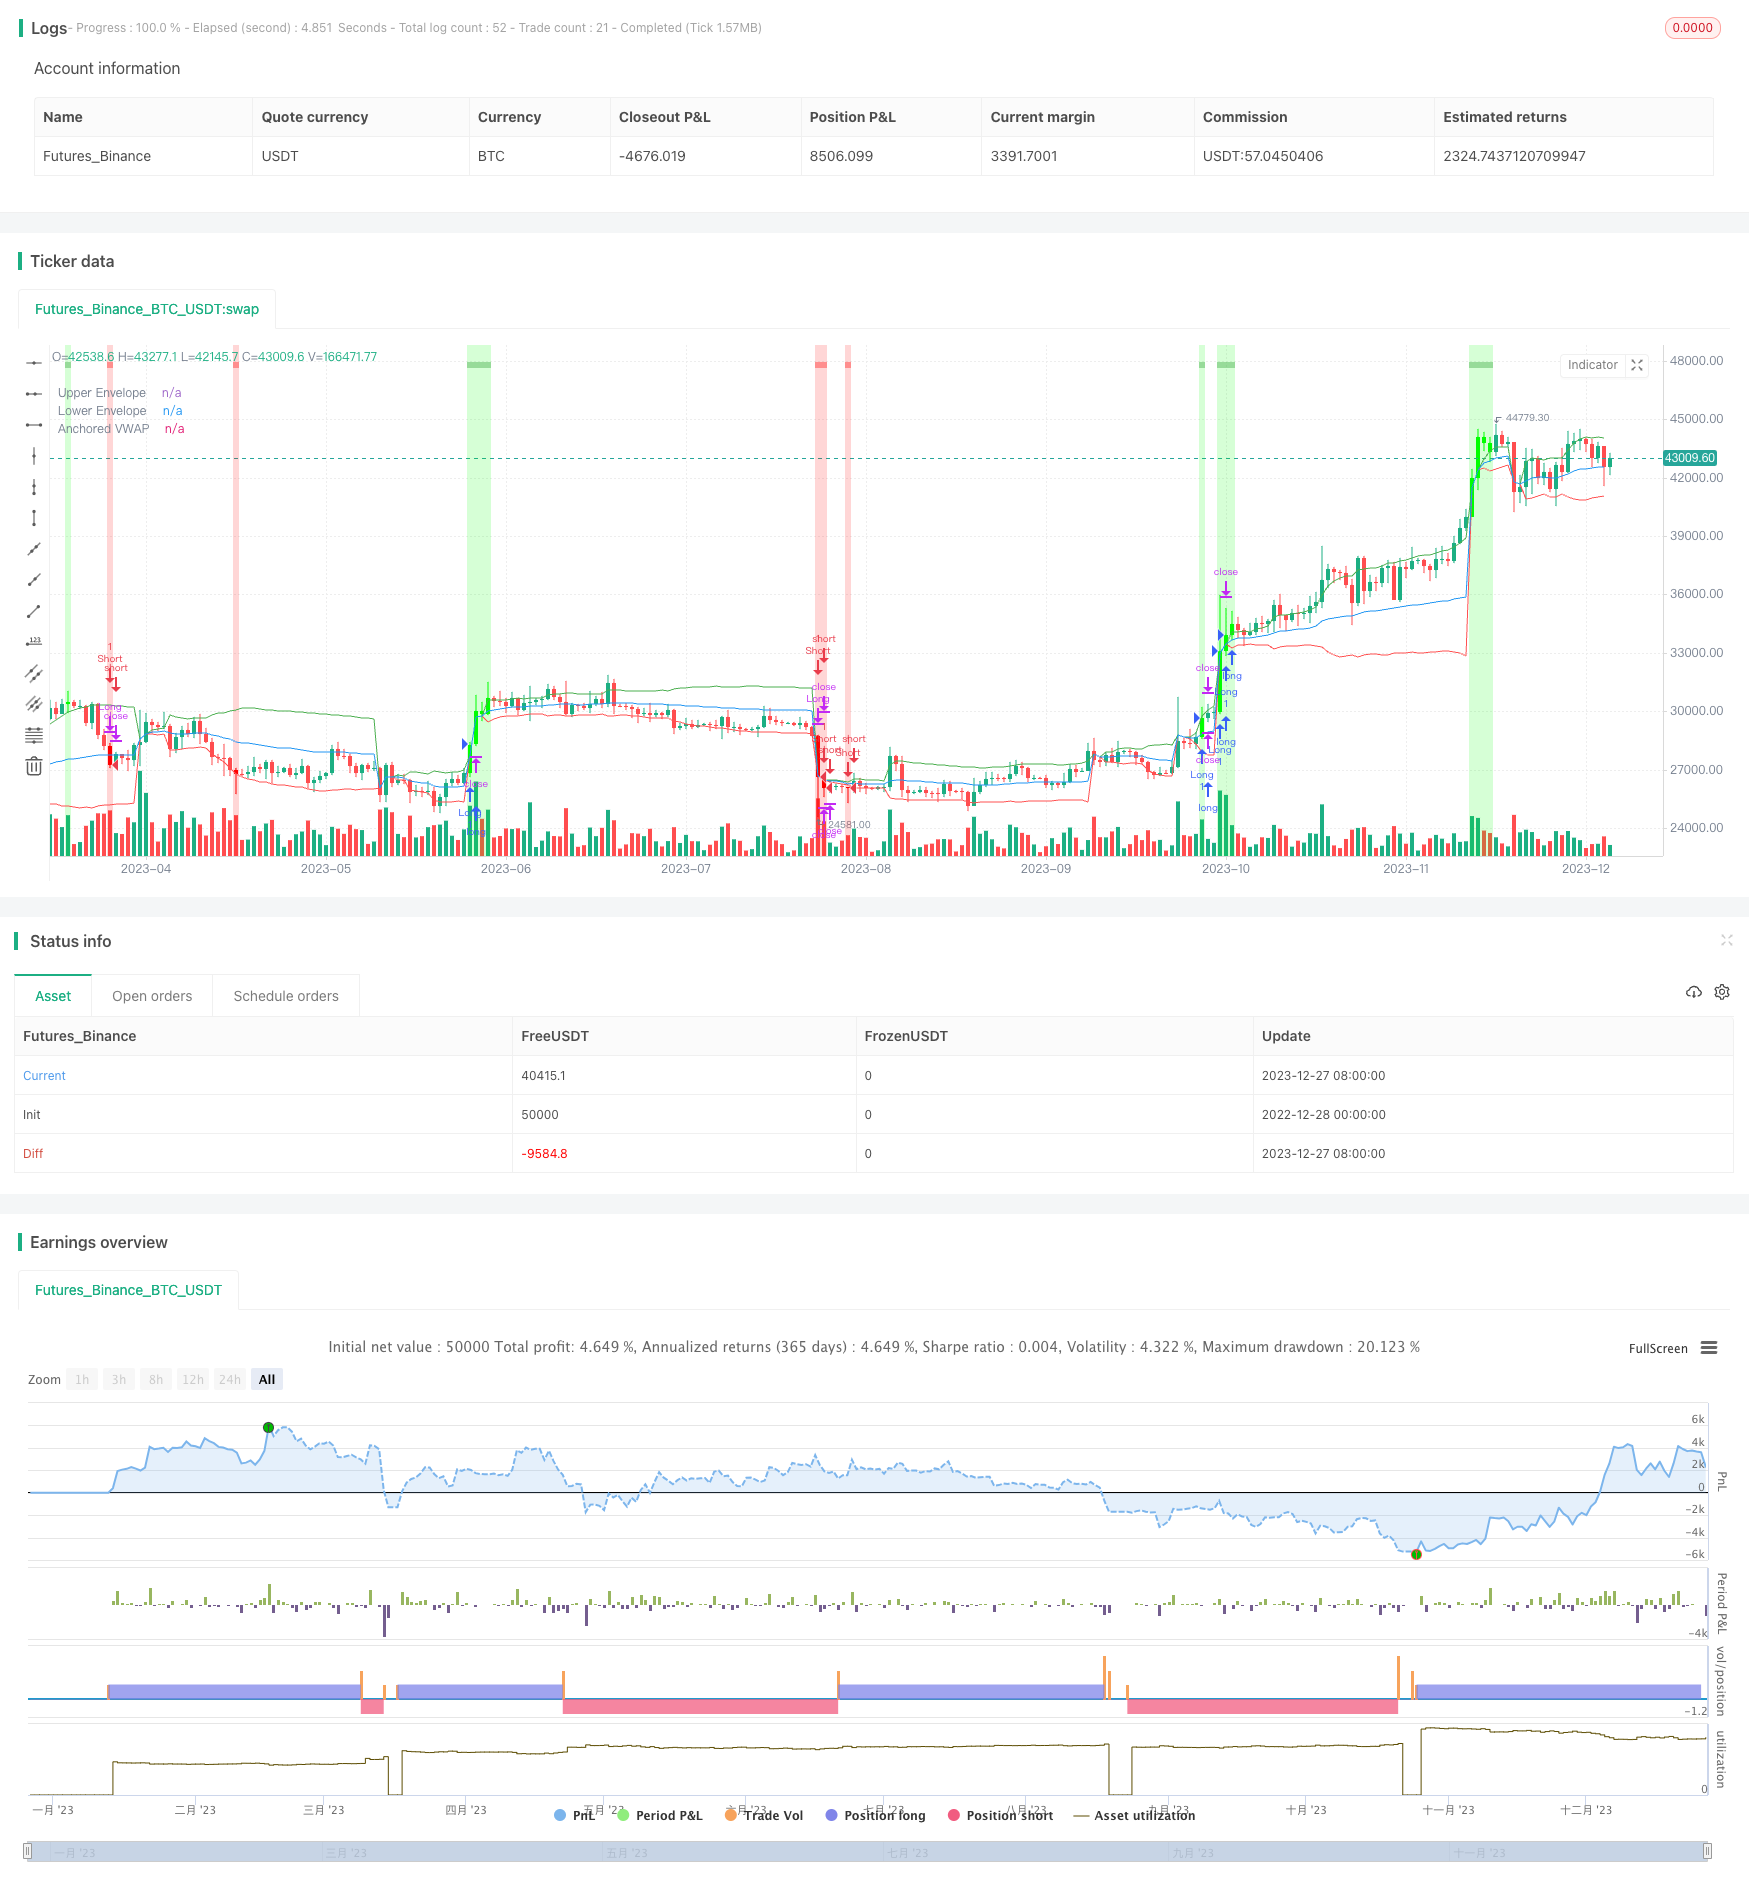
start: 2022-12-28 00:00:00
end: 2023-12-28 00:00:00
period: 1d
basePeriod: 1h
exchanges: [{"eid":"Futures_Binance","currency":"BTC_USDT"}]
*/
//@version=5
strategy('Anchored Rolling CVDVWAP Signal Strategy', overlay=true)
// User-defined settings
vwapAnchorPeriod = input.int(20, title="Rolling VWAP Anchor Period", group="Settings")
stdDevMult = input.float(2.0, title="Standard Deviation Multiplier for Envelope", group="Settings")
analysis_period = input.int(7, minval=1, maxval=100, title="Analysis Period", group="Settings")
useVwapFilter = input.bool(true, title="Use Anchored VWAP Filter", group="Filters")
useCvdFilter = input.bool(true, title="Use CVD Filter", group="Filters")
cvdLength = input.int(20, title="CVD Length", group="Filters")
tpPercent = input.float(200.0, title="Take Profit % of SL Distance", group="Trade Settings")
slPeriods = input.int(200, title="Stop Loss Lookback Period", group="Trade Settings")
toggleSignals = input.bool(false, title="Toggle Signals", group="Settings")
// Finding the anchor bar
highestVol = ta.highest(volume, vwapAnchorPeriod)
var int anchorBar = na
if volume == highestVol
anchorBar := bar_index
// Initializing variables for anchored VWAP and envelope calculation
var float avwapNumerator = na
var float avwapDenominator = na
var float anchoredVwap = na
var float sum = 0.0
var int count = 0
var float sumDev = 0.0
// Calculating Anchored VWAP and envelope
if not na(anchorBar)
if bar_index == anchorBar
avwapNumerator := high * volume + low * volume + close * volume
avwapDenominator := volume * 3
sum := 0.0
count := 0
sumDev := 0.0
else if bar_index > anchorBar
avwapNumerator := avwapNumerator[1] + high * volume + low * volume + close * volume
avwapDenominator := avwapDenominator[1] + volume * 3
sum := sum[1] + close
count := count[1] + 1
sumDev := sumDev[1] + math.pow(close - (sum / count), 2)
anchoredVwap := avwapNumerator / avwapDenominator
// Standard deviation envelope calculation
float mean = sum / math.max(count, 1)
float stDev = math.sqrt(sumDev / math.max(count, 1))
float upperBand = anchoredVwap + stdDevMult * stDev
float lowerBand = anchoredVwap - stdDevMult * stDev
// CVD calculation and filter application
cvd = ta.cum(volume - ta.sma(volume, cvdLength))
bool cvdCondition = useCvdFilter ? (cvd[1] < cvd and cvd > cvd[1]) : true
// Dip and Rip pattern detection
roc = ta.roc(close, analysis_period)
dip_move_value = input.float(-8, title="Down (%)", step=0.50, minval=-100, maxval=-0.01, group="Settings")
rip_move_value = input.float(8, title="Up (%)", step=0.50, minval=0.01, maxval=100.00, group="Settings")
dip = roc <= dip_move_value and cvdCondition and (not useVwapFilter or close < anchoredVwap)
rip = roc >= rip_move_value and cvdCondition and (not useVwapFilter or close > anchoredVwap)
// State variables for signals and TP/SL execution
var bool inTrade = false // If we are currently in a trade
var bool takeLong = false // If the last signal was a buy
var bool takeShort = false // If the last signal was a sell
var float tradeEntryPrice = na // The trade entry price
var float tradeSL = na // The current trade's Stop Loss level
var float tradeTP = na // The current trade's Take Profit level
// Setting SL and TP levels for the trade
tradeSL := dip ? ta.highest(high, slPeriods) : (rip ? ta.lowest(low, slPeriods) : tradeSL)
tradeTP := dip ? tradeEntryPrice - (tradeSL - tradeEntryPrice) * tpPercent / 100 : (rip ? tradeEntryPrice + (tradeEntryPrice - tradeSL) * tpPercent / 100 : tradeTP)
// Trade entry logic
if (dip or rip) and not inTrade
tradeEntryPrice := close
inTrade := true
takeLong := rip
takeShort := dip
// Trade exit logic at TP or SL
if inTrade and ((takeLong and (low < tradeSL or high > tradeTP)) or (takeShort and (high > tradeSL or low < tradeTP)))
inTrade := false // Exit the trade
// Display logic for signals based on the toggle
bool showLongSignal = rip and (not toggleSignals or not takeLong)
bool showShortSignal = dip and (not toggleSignals or not takeShort)
// Reset signals if toggle is active and trade is exited
if toggleSignals and not inTrade
takeLong := true
takeShort := true
// Strategy entry and exit logic
if showLongSignal
strategy.entry("Long", strategy.long)
if showShortSignal
strategy.close("Long")
if showShortSignal
strategy.entry("Short", strategy.short)
if showLongSignal
strategy.close("Short")
// Plotting of entry signals, anchored VWAP, and envelope
plot(upperBand, title="Upper Envelope", color=color.green)
plot(lowerBand, title="Lower Envelope", color=color.red)
plot(anchoredVwap, title="Anchored VWAP", color=color.blue)
// Coloring and shapes for Dip and Rip
barcolor(dip ? color.rgb(255, 0, 0) : na, title="Down Bar Color")
bgcolor(dip ? color.rgb(255, 0, 0, 80) : na, title="Down Background Color")
plotshape(dip, title="Dip - Down", location=location.top, color=color.rgb(255, 82, 82, 45), style=shape.square, size=size.tiny)
barcolor(rip ? color.rgb(0, 255, 0) : na, title="Up Bar Color")
bgcolor(rip ? color.rgb(0, 255, 0, 80) : na, title="Up Background Color")
plotshape(rip, title="Rip - Up", location=location.top, color=color.rgb(76, 175, 79, 55), style=shape.square, size=size.tiny)
// Strategy exit conditions for TP and SL
strategy.exit("Take Profit Long", from_entry = "Long", limit = tradeTP)
strategy.exit("Stop Loss Long", from_entry = "Long", stop = tradeSL)
strategy.exit("Take Profit Short", from_entry = "Short", limit = tradeTP)
strategy.exit("Stop Loss Short", from_entry = "Short", stop = tradeSL)