개요
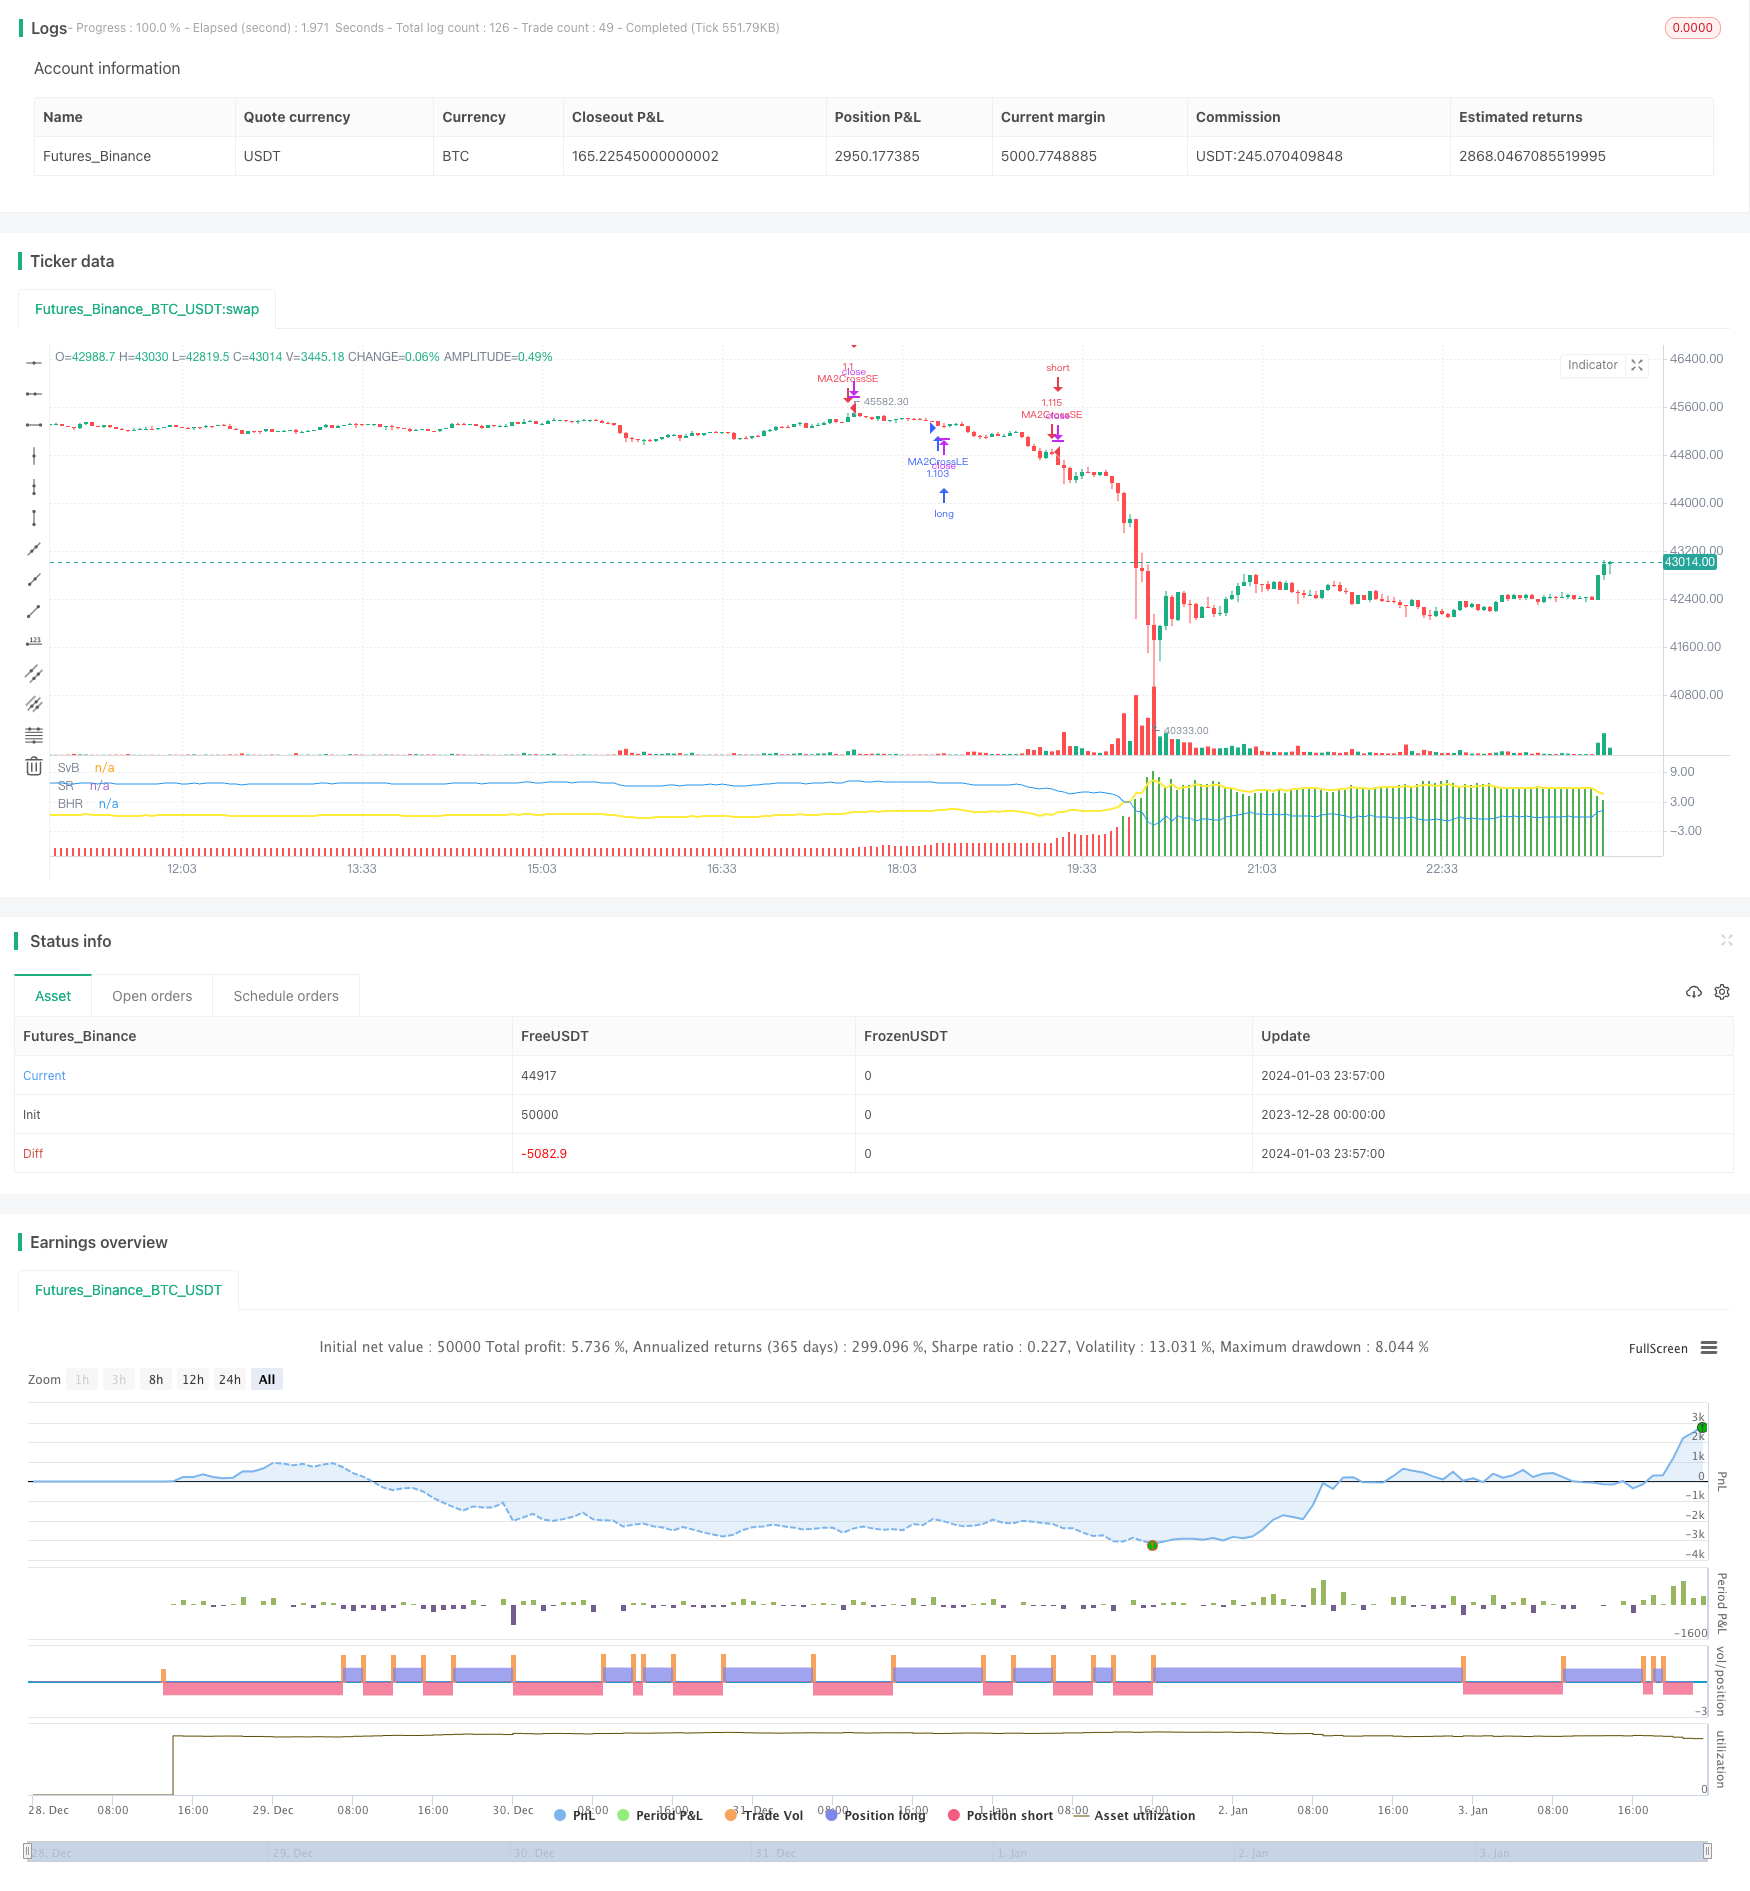
이 전략은 상세한 지표와 차트를 통해 주어진 전략과 거래된 증권의 구매 보유 수익을 직관적으로 비교한다.
전략 원칙
이 전략의 핵심 논리는 주어진 전략과 구매 보유 전략의 차이를 비교하는 네 가지 핵심 요소를 도출하는 것입니다.
- 전략의 순이익: 전략의 순이익과 실현되지 않은 이익의 합
- 매입 보유 순이익: 수익이 발생하지 않았다.
- 이차: 전략적 순이익 - 매입 보유 순이익
- 전략 VS 매입 보유 통계 지표
- 전략적 순이익은 Bar의 매입 비율보다 높습니다.
- 전략적 순이익은 매입 및 보유한 Bar의 비율보다 낮습니다.
- 전략과 구매 보유 평균의 차이는
위의 네 가지 요소를 비교함으로써 전략과 단순 구매 보유 사이의 장단점을 명확하게 직관적으로 이해할 수 있습니다.
전략적 강점 분석
이 전략은 단순한 구매와 보유 수익 비교에 비해 다음과 같은 장점이 있습니다.
더 포괄적이고 세밀한 비교 지표. K 라인별 비교, 전체적인 통계 자료의 비교 등으로 전략이 이기고 잃는 곳을 더 명확하게 알 수 있습니다.
직관적인 비교 차트. 전략의 순이익, 매입 보유의 순이익, 둘의 차이의 차트를 그리는 것으로 전략의 성과를 시각적으로 더 빨리 판단할 수 있다.
사용자 정의 비교 기간. 우리는 전략의 성과를 더 잘 분석하기 위해 특정 기간 동안 구매와 보유에 대한 전략의 비교에만 집중 할 수 있습니다.
간단하고 사용하기 쉬운。 이 정책은 완전한 비교 논리를 내장하고 있으며, 우리는 단지 자신의 정책 코드 대신 템플릿에서 대응하는 위치를 얻을 수 있습니다。 비교 논리를 직접 작성할 필요가 없습니다。
위험 분석
이 전략은 주로 거래 플랫폼에서 가져온 구매 보유 수익 지표를 비교합니다. 이 내장 지표가 편차하면 최종 비교 결과에 영향을 미칠 수 있습니다. 또한, 전략의 통계 지표의 계산 방법은 전략과 구매 보유 사이의 비교 상황을 100% 정확하게 반영 할 수없는 오류가있을 수 있습니다.
더 많은 기준과 비교하고, 더 많은 통계학적 방법을 도입하는 등의 방법으로 전략의 성과를 더욱 검증할 수 있다. 거래 플랫폼 업그레이드 후 구매 보유 수익 지표가 큰 편차를 일으킨다면, 전략의 비교 논리를 조정할 필요가 있다.
최적화 방향
이 전략은 다음과 같은 부분에서 최적화될 수 있습니다.
3자 또는 다자 비교를 위한 더 많은 기준을 추가하십시오. 예를 들어, 상위 지수 또는 업계 지표의 비교를 추가할 수 있습니다.
연간, 분기별 우승률, 최대 철회 시간 차이 등과 같은 더 많은 통계 지표를 추가하십시오. 우리는 더 많은 차원에서 전략을 이해할 수 있습니다.
파라미탈화 설정 추가. 비교 기간 이외에 사용자 지정할 수 있는 더 많은 내용을 추가합니다. 예를 들어, 비교 기준, 통계 지표 등이 있습니다.
최적화 도표 표시 ᄒ 현재 간단한 선 도표 표시는 전략과 구매 보유가 특정 시점의 어느 시점에 있는지 명확하게 비교하기 어려울 수 있으며, 기둥 도표를 그리거나 표시를 추가하여 가독성을 향상시킬 수 있습니다.
요약하다
이 전략은 여러 가지 세부적인 비교 지표와 직관적인 차트를 디자인하여 사용자 정의 전략과 간단한 구매 보유 전략의 차이를 매우 명확하고 전체적으로 이해할 수있게 해줍니다. 따라서 전략의 성능을 더 잘 개선 할 수 있습니다. 사용자 정의 가능한 비교 기간은 또한 다양한 단계에서 전략의 장단점을 유연하게 분석 할 수 있습니다.
이 전략은 비교 기준, 통계 지표, 그리고 그래프로 표현된다면 매우 강력한 전략 분석 도구가 될 수 있습니다. 이 전략은 우리에게 전략 분석과 개선 작업을 더 효율적으로 할 수 있는 템플릿과 프레임워크를 제공합니다.
/*backtest
start: 2023-12-28 00:00:00
end: 2024-01-04 00:00:00
period: 3m
basePeriod: 1m
exchanges: [{"eid":"Futures_Binance","currency":"BTC_USDT"}]
*/

//@version=4
strategy("VS Buy Hold", precision=2)

bnh_info_panel = input(true, title='Enable Info Panel')
bnh_indicator_panel = input(true, title='Enable Indicator Panel')

//COMPARISON DATE RANGE//
bnh_FromYear = input(1970, title="From Year", minval=1970)
bnh_FromMonth = input(1, title="From Month", minval=1, maxval=12)
bnh_FromDay = input(1, title="From Day", minval=1, maxval=31)

bnh_ToYear = input(2050, title="To Year", minval=2010)
bnh_ToMonth = input(12, title="To Month", minval=1, maxval=12)
bnh_ToDay = input(31, title="To Day", minval=1, maxval=31)

bnh_start = timestamp(bnh_FromYear, bnh_FromMonth, bnh_FromDay, 00, 00)
bnh_finish = timestamp(bnh_ToYear, bnh_ToMonth, bnh_ToDay, 23, 59)
bnh_timeCond = time >= bnh_start and time <= bnh_finish ? true: false

//Note: If you are going to use the COMPARISON DATE RANGE above, apply bnh_timeCond
//      to your strategy parameters.


/////////////////////////////////////////////////////////////////////////////////////
//////////////////////////////STRATEGY SCRIPT START//////////////////////////////////

//=========================PLACEHOLDER MA CROSS STRATEGY=========================//
fastLength = 50
slowLength = 200
price = close

mafast = sma(price, fastLength)
maslow = sma(price, slowLength)
strategy.initial_capital = 50000
positionSize = strategy.initial_capital / close

if (crossover(mafast, maslow) and bnh_timeCond) // <= bnh_timeCond added as a condition
    strategy.entry("MA2CrossLE", strategy.long, positionSize, comment="MA2CrossLE")

if (crossunder(mafast, maslow) and bnh_timeCond) // <= bnh_timeCond added as a condition
    strategy.entry("MA2CrossSE", strategy.short, positionSize, comment="MA2CrossSE")

//////////////////////////////STRATEGY SCRIPT END////////////////////////////////////
/////////////////////////////////////////////////////////////////////////////////////


//STRATEGY EQUITY
strategy_pnl = strategy.netprofit + strategy.openprofit
bnh_strategy_pnl_pcnt = (strategy_pnl / strategy.initial_capital) * 100


//BUY AND HOLD EQUITY
float bnh_start_bar = na
bnh_start_bar := na(bnh_start_bar[1]) and bnh_timeCond? close : bnh_start_bar[1]
bnl_buy_hold_equity = ((close - bnh_start_bar)/bnh_start_bar) * 100


//STRATEGY VS BUY AND HOLD STATS
bnh_vs_diff = bnh_strategy_pnl_pcnt - bnl_buy_hold_equity

bnh_bar_counter = 0
bnh_bar_counter := bnh_vs_diff > 0 ? nz(bnh_bar_counter[1]) + 1 : bnh_bar_counter[1]

bnh_bar_counter2 = 0
bnh_bar_counter2 := bnh_vs_diff <= 0 ? nz(bnh_bar_counter2[1]) + 1 : bnh_bar_counter2[1]

bnh_pcnt_above = (bnh_bar_counter/(bnh_bar_counter + bnh_bar_counter2))*100
bnh_pcnt_below = (bnh_bar_counter2/(bnh_bar_counter + bnh_bar_counter2))*100

bnh_average_diff = cum(bnh_vs_diff) / (bnh_bar_counter + bnh_bar_counter2)


//PLOTS AND LABELS
bnh_diff_color = bnh_vs_diff > 0 ? color.green : color.red
plot(bnh_vs_diff, style=plot.style_columns, color=bnh_diff_color, transp=60, title='SvB')
plot(bnh_strategy_pnl_pcnt, color=color.yellow, linewidth=2, title="SR")
plot(bnl_buy_hold_equity, color=color.blue, title="BHR")

// draw_IndicatorLabel(_text, _x, _y, label_color, font_color)=>
//     string_text = _text
//     var label la_indicator = na
//     label.delete(la_indicator)
//     la_indicator := label.new(
//          x=_x, y=_y,
//          text=string_text, xloc=xloc.bar_index, yloc=yloc.price,
//          color=label_color, style=label.style_labeldown, textcolor=font_color, size=size.small)

// draw_InfoPanel(_text, _x, _y, font_size)=>
//     var label la_panel = na
//     label.delete(la_panel)
//     la_panel := label.new(
//          x=_x, y=_y,
//          text=_text, xloc=xloc.bar_time, yloc=yloc.price,
//          color=color.new(#383838, 5), style=label.style_labelup, textcolor=color.white, size=font_size)

// if bnh_indicator_panel
//     draw_IndicatorLabel("Difference", bar_index, bnh_vs_diff, color.new(color.gray, 40), color.white)
//     draw_IndicatorLabel("Strategy P/L", bar_index, bnh_strategy_pnl_pcnt, color.new(color.yellow, 50), color.white)
//     draw_IndicatorLabel("Buy & Hold P/L", bar_index, bnl_buy_hold_equity, color.new(color.blue, 50), color.white)

// info_panel_x = time_close + round(change(time) * 200)
// info_panel_y = max(max(bnl_buy_hold_equity, bnh_strategy_pnl_pcnt), bnh_vs_diff) + abs(bnh_vs_diff * 0.25)


// title = "STRATEGY vs BUY & HOLD STATS"
// row0 = "-----------------------------------------------------"
// row1 = 'Bars Above Buy & Hold: ' + tostring(bnh_pcnt_above, '#.##') + '%'
// row2 = 'Bars Below Buy & Hold: ' + tostring(bnh_pcnt_below, '#.##') + '%'
// row3 = 'All Time Ave. Difference: ' + tostring(bnh_average_diff, '#.##') + '%'

// panel_text = '\n' + title + '\n' + row0 + '\n' + row1 + '\n\n' + row2 + '\n\n' + row3 + '\n'

// if bnh_info_panel
//     draw_InfoPanel(panel_text, info_panel_x, info_panel_y, size.normal)