개요
이 전략은 123 역전과 MACD 지표를 결합하여 시간 프레임에 걸쳐 동력을 추적합니다. 123 역전은 단기 트렌드 역전 지점을 판단하고, MACD는 중기 트렌드를 판단하며, 둘은 단기 역전과 동시에 중기 트렌드 포커의 다공간 신호를 구현합니다.
전략 원칙
이 전략은 두 부분으로 구성되어 있습니다.
123 반전 부분: 현재 두 개의 K 선이 고/저점을 형성하고, 임의의 지표가 50보다 낮거나 높을 때 구매/판매 신호를 생성한다.
MACD 부분: 빠른 선에서 느린 선을 통과하면 구매 신호가 발생하고 빠른 선 아래 느린 선을 통과하면 판매 신호가 발생한다.
마지막으로 이 둘을 결합하여, 즉 123 회전과 동시에 MACD도 동방향 신호를 생성할 때, 최종 신호를 낸다.
우위 분석
이 전략은 단기 반전과 중장기 트렌드를 결합하여 단기 변동에 중장기 트렌드를 잠금화하여 더 높은 승률을 얻을 수 있다. 특히, 충격적인 상황에서는 123 반전으로 소음을 제거하여 안정성을 높일 수 있다.
또한, 변수를 조정하여 역전 신호와 트렌드 신호의 비율을 균형을 잡을 수 있으며, 다양한 시장 환경에 적응할 수 있다.
위험 분석
이 전략은 일정 시간 지연이 있으며, 특히 긴 주기 MACD를 사용하면 단기 시장을 놓칠 수 있다. 또한, 반전 신호 자체는 어느 정도 무작위성이 존재하여 쉽게 잡힐 수 있다.
MACD 사이클을 적절히 줄이거나, 위험을 통제하기 위해 스톱로스를 증가시킬 수 있다.
최적화 방향
이 전략은 다음과 같은 부분에서 최적화될 수 있습니다.
123 회전 변수를 조정하여 회전 효과를 최적화합니다.
MACD 변수를 조정하여 트렌드 판단을 최적화합니다.
다른 보조 지표 필터링을 추가하여 효과를 높여줍니다.
더 많은 손실을 방지하고 위험을 통제하는 전략
요약하다
이 전략은 여러 파라미터와 여러 시간 프레임의 기술 지표를 통합하여 시간 프레임의 동력을 추적하여 역전 거래와 트렌드 거래의 장점을 균형을 맞추고 있습니다. 균형 효과를 파라미터를 통해 조정할 수 있으며 더 많은 지표 또는 스톱을 도입하여 최적화 할 수 있습니다.
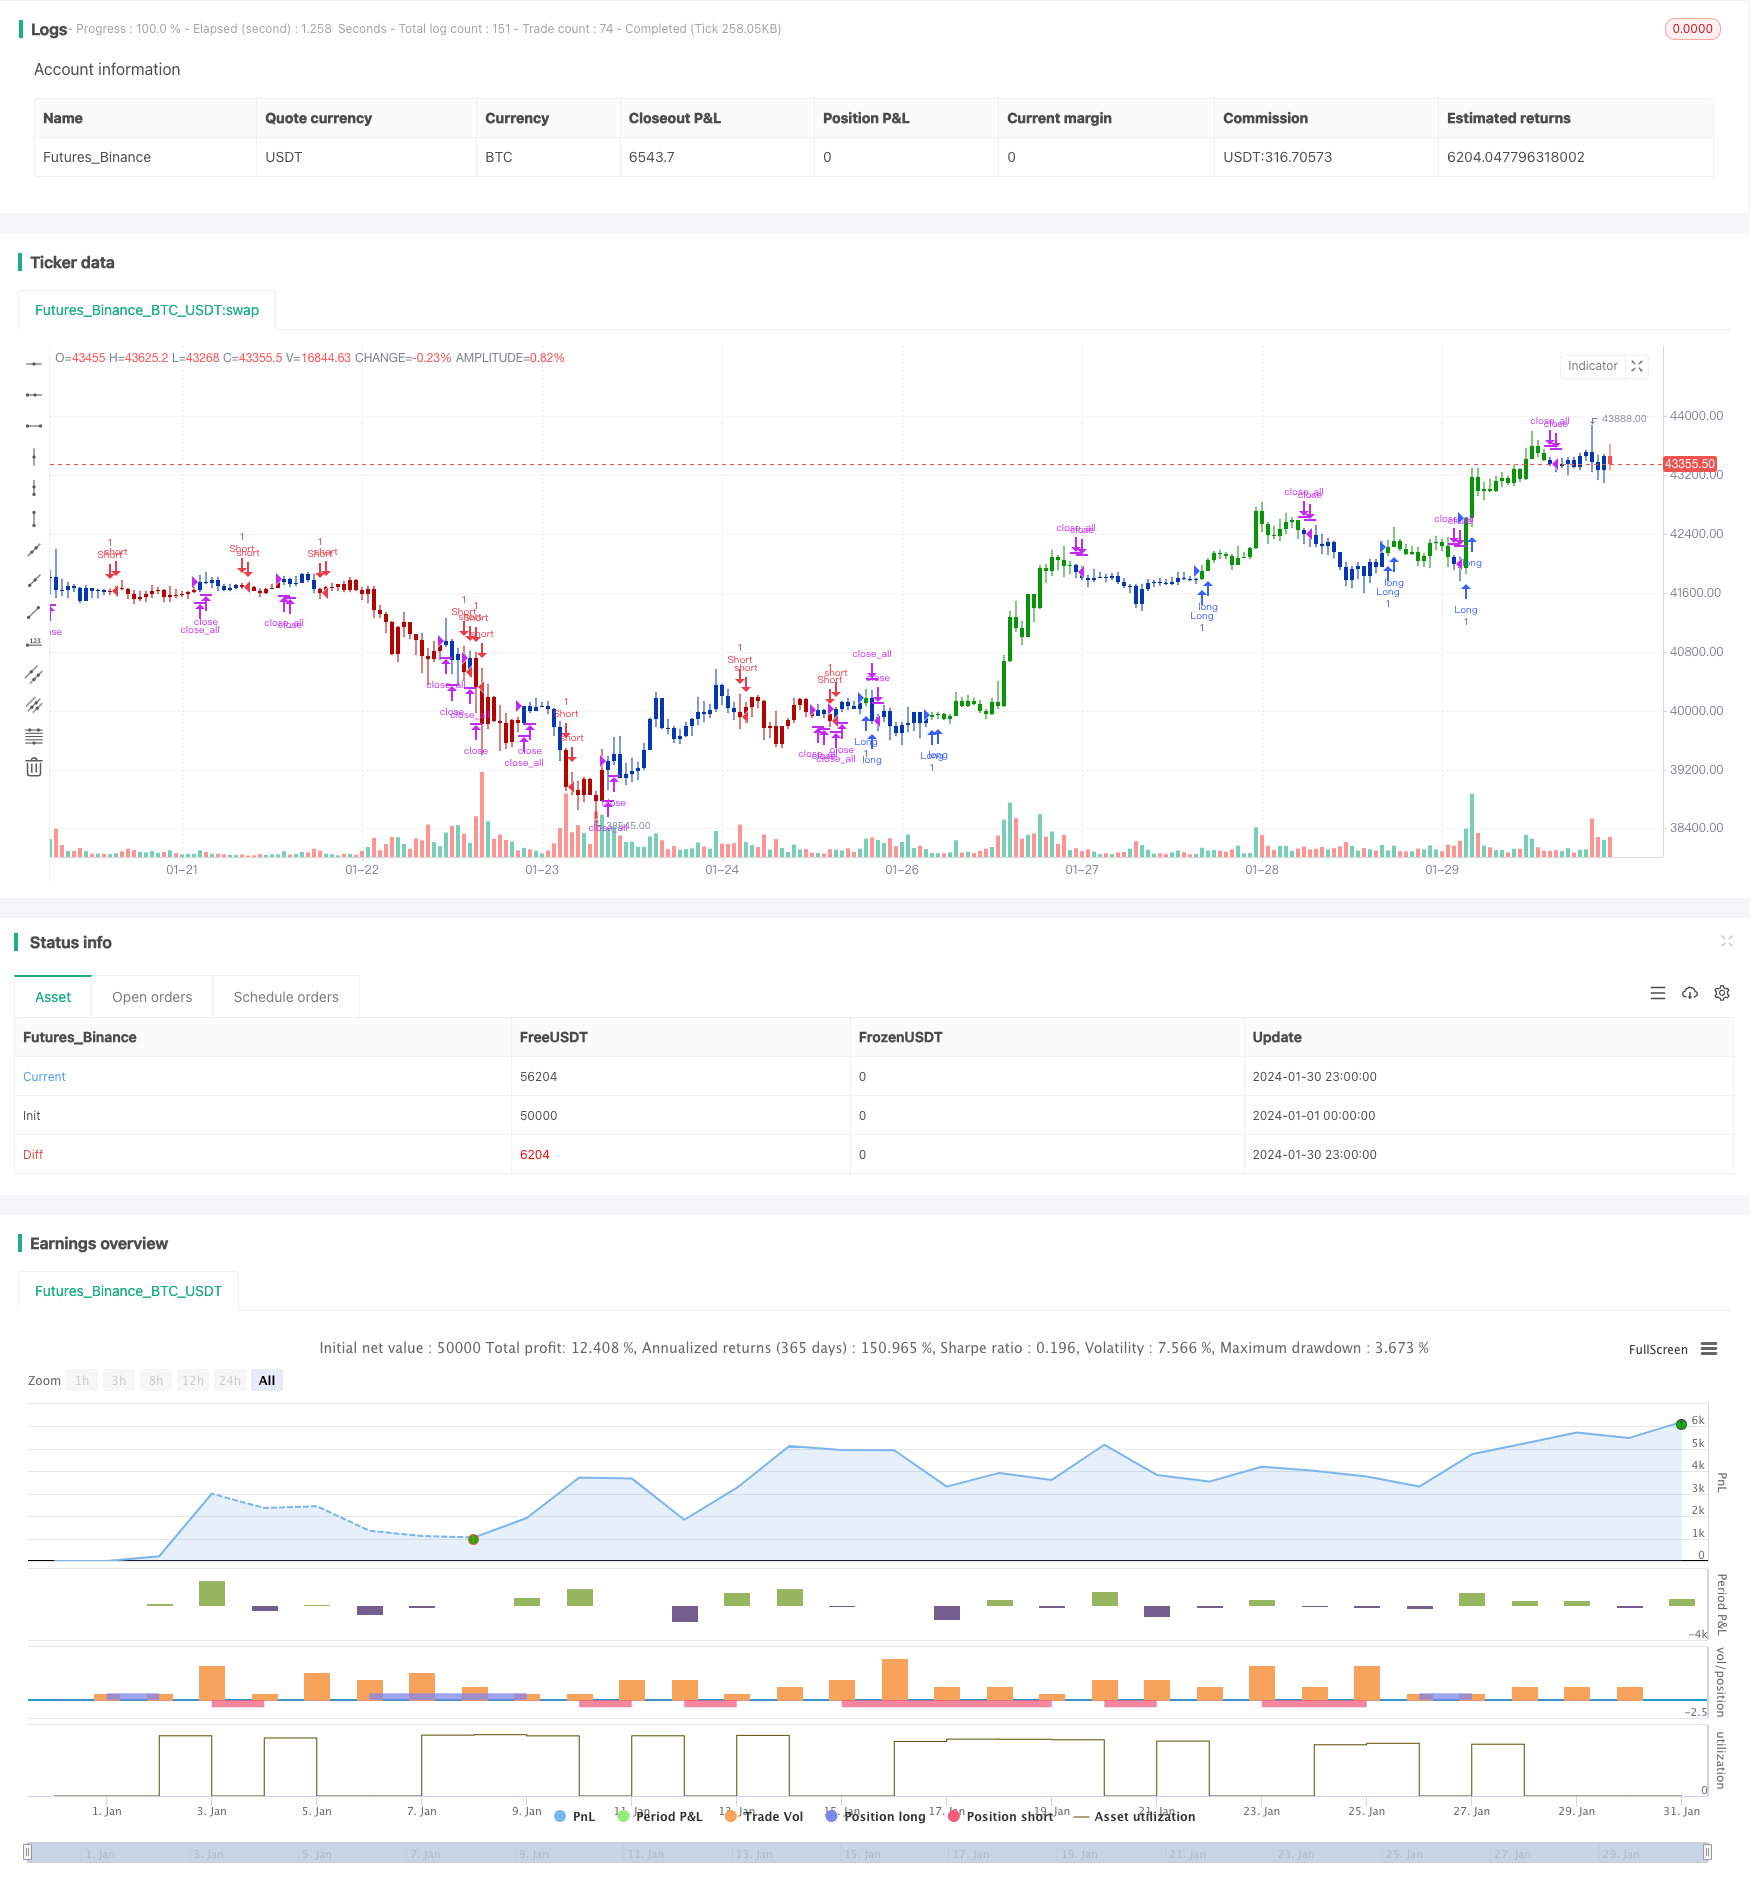
/*backtest
start: 2024-01-01 00:00:00
end: 2024-01-31 00:00:00
period: 1h
basePeriod: 15m
exchanges: [{"eid":"Futures_Binance","currency":"BTC_USDT"}]
*/

//@version=4
////////////////////////////////////////////////////////////
//  Copyright by HPotter v1.0 28/01/2021
// This is combo strategies for get a cumulative signal.
//
// First strategy
// This System was created from the Book "How I Tripled My Money In The
// Futures Market" by Ulf Jensen, Page 183. This is reverse type of strategies.
// The strategy buys at market, if close price is higher than the previous close
// during 2 days and the meaning of 9-days Stochastic Slow Oscillator is lower than 50.
// The strategy sells at market, if close price is lower than the previous close price
// during 2 days and the meaning of 9-days Stochastic Fast Oscillator is higher than 50.
//
// Second strategy
// MACD – Moving Average Convergence Divergence. The MACD is calculated
// by subtracting a 26-day moving average of a security's price from a
// 12-day moving average of its price. The result is an indicator that
// oscillates above and below zero. When the MACD is above zero, it means
// the 12-day moving average is higher than the 26-day moving average.
// This is bullish as it shows that current expectations (i.e., the 12-day
// moving average) are more bullish than previous expectations (i.e., the
// 26-day average). This implies a bullish, or upward, shift in the supply/demand
// lines. When the MACD falls below zero, it means that the 12-day moving average
// is less than the 26-day moving average, implying a bearish shift in the
// supply/demand lines.
// A 9-day moving average of the MACD (not of the security's price) is usually
// plotted on top of the MACD indicator. This line is referred to as the "signal"
// line. The signal line anticipates the convergence of the two moving averages
// (i.e., the movement of the MACD toward the zero line).
// Let's consider the rational behind this technique. The MACD is the difference
// between two moving averages of price. When the shorter-term moving average rises
// above the longer-term moving average (i.e., the MACD rises above zero), it means
// that investor expectations are becoming more bullish (i.e., there has been an
// upward shift in the supply/demand lines). By plotting a 9-day moving average of
// the MACD, we can see the changing of expectations (i.e., the shifting of the
// supply/demand lines) as they occur.
//
// WARNING:
// - For purpose educate only
// - This script to change bars colors.
////////////////////////////////////////////////////////////
Reversal123(Length, KSmoothing, DLength, Level) =>
    vFast = sma(stoch(close, high, low, Length), KSmoothing)
    vSlow = sma(vFast, DLength)
    pos = 0.0
    pos := iff(close[2] < close[1] and close > close[1] and vFast < vSlow and vFast > Level, 1,
	         iff(close[2] > close[1] and close < close[1] and vFast > vSlow and vFast < Level, -1, nz(pos[1], 0)))
	pos

MACD(fastLength,slowLength,signalLength) =>
    pos = 0.0
    fastMA = ema(close, fastLength)
    slowMA = ema(close, slowLength)
    macd = fastMA - slowMA
    signal = sma(macd, signalLength)
    pos:= iff(signal < macd , 1,
	       iff(signal > macd, -1, nz(pos[1], 0)))
    pos

strategy(title="Combo Backtest 123 Reversal & MACD Crossover", shorttitle="Combo", overlay = true)
line1 = input(true, "---- 123 Reversal ----")
Length = input(14, minval=1)
KSmoothing = input(1, minval=1)
DLength = input(3, minval=1)
Level = input(50, minval=1)
//-------------------------
fastLength = input(8, minval=1)
slowLength = input(16,minval=1)
signalLength=input(11,minval=1)
xSeria = input(title="Source", type=input.source, defval=close)
reverse = input(false, title="Trade reverse")
posReversal123 = Reversal123(Length, KSmoothing, DLength, Level)
posMACD = MACD(fastLength,slowLength, signalLength)
pos = iff(posReversal123 == 1 and posMACD == 1 , 1,
	   iff(posReversal123 == -1 and posMACD == -1, -1, 0))
possig = iff(reverse and pos == 1, -1,
          iff(reverse and pos == -1 , 1, pos))
if (possig == 1)
    strategy.entry("Long", strategy.long)
if (possig == -1)
    strategy.entry("Short", strategy.short)
if (possig == 0)
    strategy.close_all()
barcolor(possig == -1 ? #b50404: possig == 1 ? #079605 : #0536b3 )