
Strategi ini mewujudkan strategi perdagangan dua arah berdasarkan petunjuk MACD. Ia boleh melakukan plus dan minus semasa mata wang dan mata wang mati pada petunjuk MACD, dan menggabungkan penilaian indikator lain untuk menyaring beberapa isyarat.
Strategi ini terutamanya menggunakan indikator MACD untuk melakukan perdagangan dua hala. Secara khusus, ia akan mengira purata bergerak cepat, purata bergerak perlahan dan garis isyarat MACD. Ia menghasilkan lebih banyak isyarat garpu emas apabila ia melintasi rata-rata bergerak perlahan di atas rata-rata bergerak cepat; ia menghasilkan isyarat garpu mati apabila ia melintasi rata-rata bergerak perlahan di bawah rata-rata bergerak cepat.
Untuk menyaring beberapa isyarat tidak sah, strategi ini juga menetapkan julat ± 30 sebagai penapis, yang hanya akan mencetuskan isyarat perdagangan apabila garis pilar MACD melebihi julat ini. Selain itu, arah garis pilar MACD akan ditentukan pada masa kedudukan rata, hanya apabila arah dua tiang berturut-turut berubah.
Strategi ini secara keseluruhannya adalah strategi perdagangan dua hala yang asas. Ia menggunakan kelebihan indikator MACD, tetapi ia juga menambah beberapa penapis untuk mengawal kualiti isyarat. Tetapi indikator MACD sendiri mempunyai beberapa masalah, dan masih memerlukan ujian dan pengoptimuman lanjut untuk menjadikan strategi ini lebih dipercayai. Secara keseluruhannya, strategi ini meletakkan asas kepada strategi perdagangan dua hala, yang kemudiannya dapat terus dioptimumkan, menjadikannya strategi perdagangan kuantitatif yang kuat.
]
/*backtest
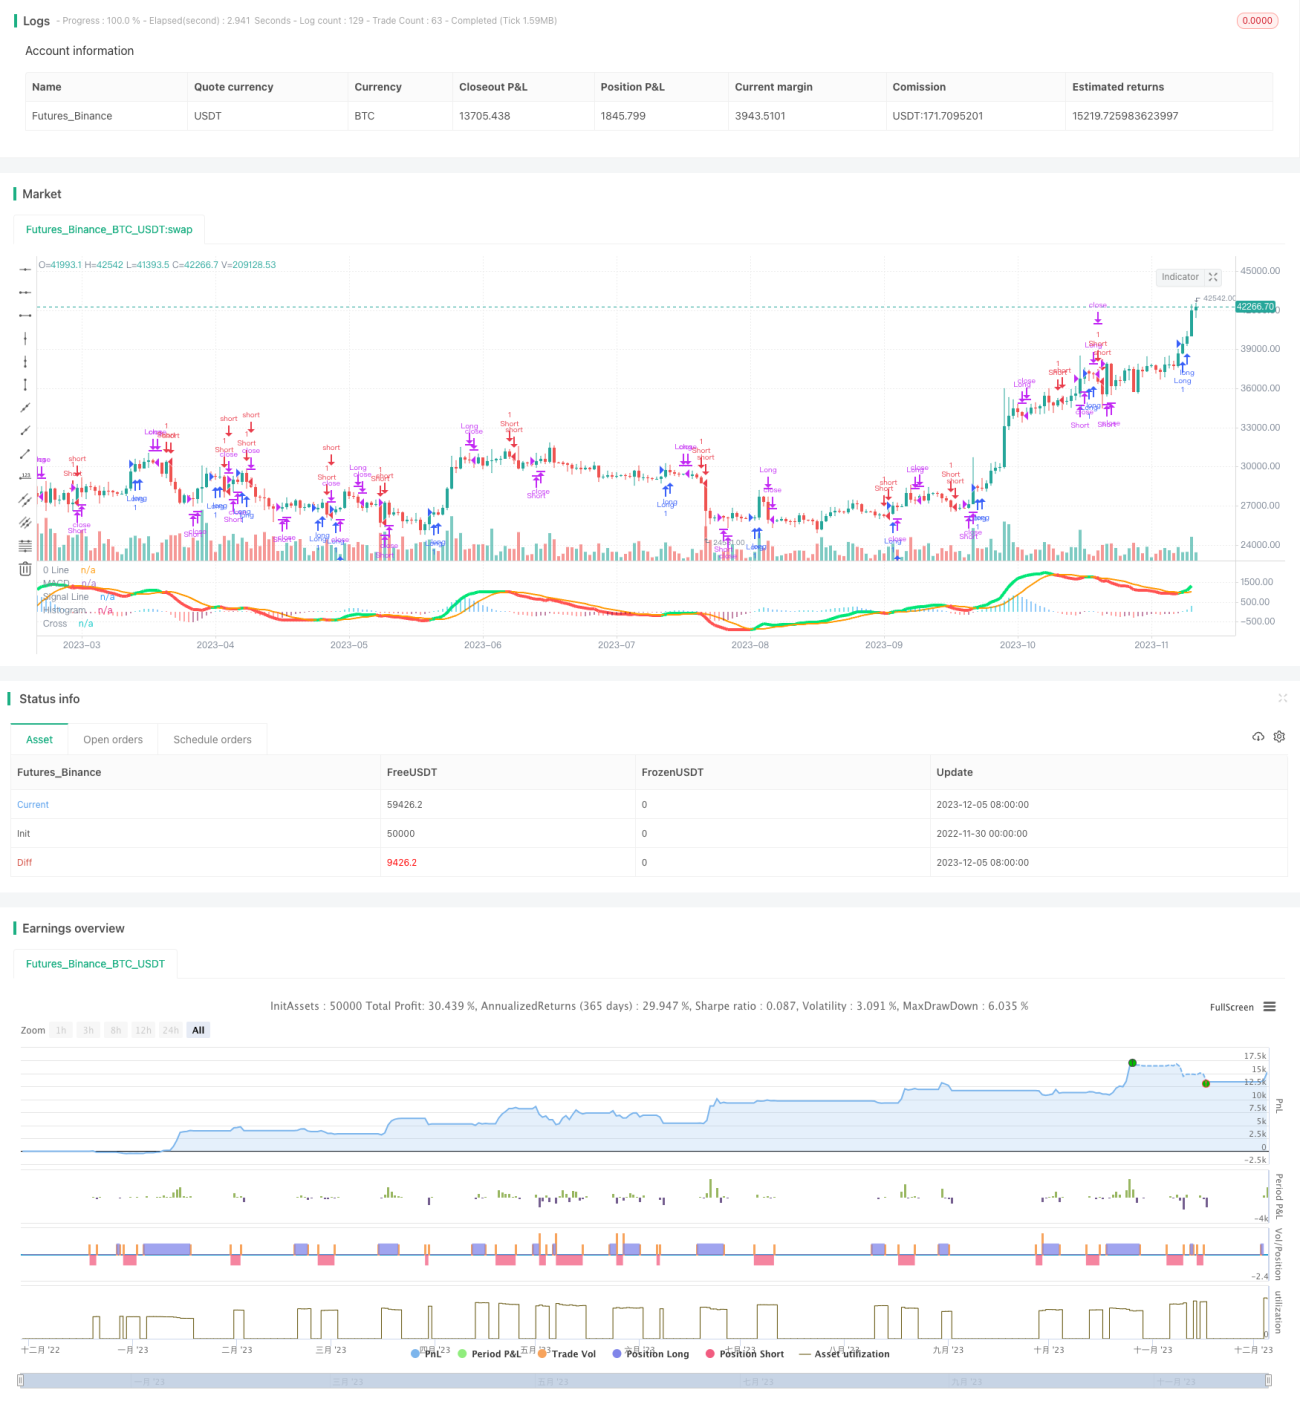
start: 2022-11-30 00:00:00
end: 2023-12-06 00:00:00
period: 1d
basePeriod: 1h
exchanges: [{"eid":"Futures_Binance","currency":"BTC_USDT"}]
*/
//@version=3
//Created by user ChrisMoody updated 4-10-2014
//Regular MACD Indicator with Histogram that plots 4 Colors Based on Direction Above and Below the Zero Line
//Update allows Check Box Options, Show MacD & Signal Line, Show Change In color of MacD Line based on cross of Signal Line.
//Show Dots at Cross of MacD and Signal Line, Histogram can show 4 colors or 1, Turn on and off Histogram.
//Special Thanks to that incredible person in Tech Support whoem I won't say you r name so you don't get bombarded with emails
//Note the feature Tech Support showed me on how to set the default timeframe of the indicator to the chart Timeframe, but also allow you to choose a different timeframe.
//By the way I fully disclose that I completely STOLE the Dots at the MAcd Cross from "TheLark"
strategy("MACD Strategy", overlay=false)
// study(title="CM_MacD_Ult_MTF", shorttitle="CM_Ult_MacD_MTF")
source = close
useCurrentRes = input(true, title="Use Current Chart Resolution?")
resCustom = input(title="Use Different Timeframe? Uncheck Box Above", defval="60")
smd = input(true, title="Show MacD & Signal Line? Also Turn Off Dots Below")
sd = input(true, title="Show Dots When MacD Crosses Signal Line?")
sh = input(true, title="Show Histogram?")
macd_colorChange = input(true,title="Change MacD Line Color-Signal Line Cross?")
hist_colorChange = input(true,title="MacD Histogram 4 Colors?")
res = useCurrentRes ? timeframe.period : resCustom
fastLength = input(12, minval=1), slowLength=input(26,minval=1)
signalLength=input(9,minval=1)
fastMA = ema(source, fastLength)
slowMA = ema(source, slowLength)
macd = fastMA - slowMA
signal = sma(macd, signalLength)
hist = macd - signal
outMacD = request.security(syminfo.tickerid, res, macd)
outSignal = request.security(syminfo.tickerid, res, signal)
outHist = request.security(syminfo.tickerid, res, hist)
histA_IsUp = outHist > outHist[1] and outHist > 0
histA_IsDown = outHist < outHist[1] and outHist > 0
histB_IsDown = outHist < outHist[1] and outHist <= 0
histB_IsUp = outHist > outHist[1] and outHist <= 0
//MacD Color Definitions
macd_IsAbove = outMacD >= outSignal
macd_IsBelow = outMacD < outSignal
// strategy.entry("Long", strategy.long, 1, when = shouldPlaceLong)
// strategy.close("Long", shouldExitLong)
// strategy.entry("Short", strategy.short, 1, when = shouldPlaceShort)
// strategy.close("Short", shouldExitShort)
isWithinZeroMacd = outHist < 30 and outHist > -30
delta = hist
// shouldExitShort = false//crossover(delta, 0)
// shouldExitLong = false//crossunder(delta, 0)
// if(crossover(delta, 0))// and not isWithinZeroMacd)
// strategy.entry("Long", strategy.long, comment="Long")
// if (crossunder(delta, 0))// and not isWithinZeroMacd)
// strategy.entry("Short", strategy.short, comment="Short")
shouldPlaceLong = crossover(delta, 0)
strategy.entry("Long", strategy.long, 1, when = shouldPlaceLong)
shouldExitLong = not histA_IsUp and histA_IsDown
shouldExitShort = not histA_IsUp and not histA_IsDown and not histB_IsDown and histB_IsUp
shouldPlaceShort = crossunder(delta, 0)
strategy.entry("Short", strategy.short, 1, when = shouldPlaceShort)
// plot_color = gray
plot_color = if(hist_colorChange)
if(histA_IsUp)
aqua
else
if(histA_IsDown)
//need to sell
// if(not isWithinZeroMacd)
// shouldExitLong = true
// strategy.entry("Short", strategy.short, comment="Short")
blue
else
if(histB_IsDown)
red
else
if(histB_IsUp)
//need to buy
// if(not isWithinZeroMacd)
// shouldExitShort = true
// strategy.entry("Long", strategy.long, comment="Long")
maroon
else
yellow
else
gray
// plot_color = hist_colorChange ? histA_IsUp ? aqua : histA_IsDown ? blue : histB_IsDown ? red : histB_IsUp ? maroon :yellow :gray
macd_color = macd_colorChange ? macd_IsAbove ? lime : red : red
signal_color = macd_colorChange ? macd_IsAbove ? orange : orange : lime
circleYPosition = outSignal
plot(smd and outMacD ? outMacD : na, title="MACD", color=macd_color, linewidth=4)
plot(smd and outSignal ? outSignal : na, title="Signal Line", color=signal_color, style=line ,linewidth=2)
plot(sh and outHist ? outHist : na, title="Histogram", color=plot_color, style=histogram, linewidth=4)
plot(sd and cross(outMacD, outSignal) ? circleYPosition : na, title="Cross", style=circles, linewidth=4, color=macd_color)
// plot( isWithinZeroMacd ? outHist : na, title="CheckSmallHistBars", style=circles, linewidth=4, color=black)
hline(0, '0 Line', linewidth=2, color=white)
strategy.close("Short", shouldExitShort)
strategy.close("Long", shouldExitLong)
// fastLength = input(12)
// slowlength = input(26)
// MACDLength = input(9)
// MACD = ema(close, fastLength) - ema(close, slowlength)
// aMACD = ema(MACD, MACDLength)
// delta = MACD - aMACD
// if (crossover(delta, 0))
// strategy.entry("MacdLE", strategy.long, comment="MacdLE")
//if last two macd bars are higher than current, close long position
// if (crossunder(delta, 0))
// strategy.entry("MacdSE", strategy.short, comment="MacdSE")
//if last two macd bars are higher than current, close long position
// plot(strategy.equity, title="equity", color=red, linewidth=2, style=areabr)