
Strategi titik persilangan dua garis rata adalah strategi perdagangan kuantitatif berdasarkan purata bergerak. Ia menentukan trend harga dengan mengira persilangan garis cepat dan lambat, dan menghantar isyarat beli dan jual di persilangan. Strategi ini menggunakan garis rata Hull sebagai garis cepat dan penapis Super Smoother sebagai garis perlahan.
Rumus pengiraan untuk strategi titik titik dua garis sejajar adalah seperti berikut:
Garis laju ((Hull mean line): WMA ((2 * WMA ((value,n/2) -WMA ((value,n),SQRT ((n))
Garis perlahan ((Super Smoother): Nilai tiga kali penapis
Di antaranya, WMA mewakili purata bergerak bertimbangan, SQRT mewakili akar kuadrat terbuka, dan penapis mengandungi satu ketinggalan satu peringkat dan dua ketinggalan peringkat kedua.
Strategi untuk menentukan hubungan silang antara dua garis dengan mengira nilai garis cepat dan lambat, di mana:
Menerobos talian perlahan untuk membeli isyarat
Garis laju di bawah garis perlahan adalah isyarat untuk menjual.
Strategi titik titik silang dua garis rata menggabungkan kelebihan penilaian dua garis rata dan perdagangan titik, dapat menangkap titik perubahan trend dengan tepat, masuk dan keluar tepat pada masanya. Berbanding dengan strategi garis rata tunggal, ia mempunyai kelebihan berikut:
Strategi dua titik persilangan linear juga mempunyai risiko:
Strategi titik titik penyambungan dua garis sejajar boleh dioptimumkan dari dimensi berikut:
Strategi titik titik silang dua garis rata mewarisi kelebihan strategi garis rata, mengembangkan penggunaan penilaian dua garis rata dan cara perdagangan titik, membentuk satu program perdagangan kuantitatif yang lebih maju dan dipercayai. Ia mempunyai kelebihan yang unik dalam perdagangan masa, yang patut diuji dan diterokai.
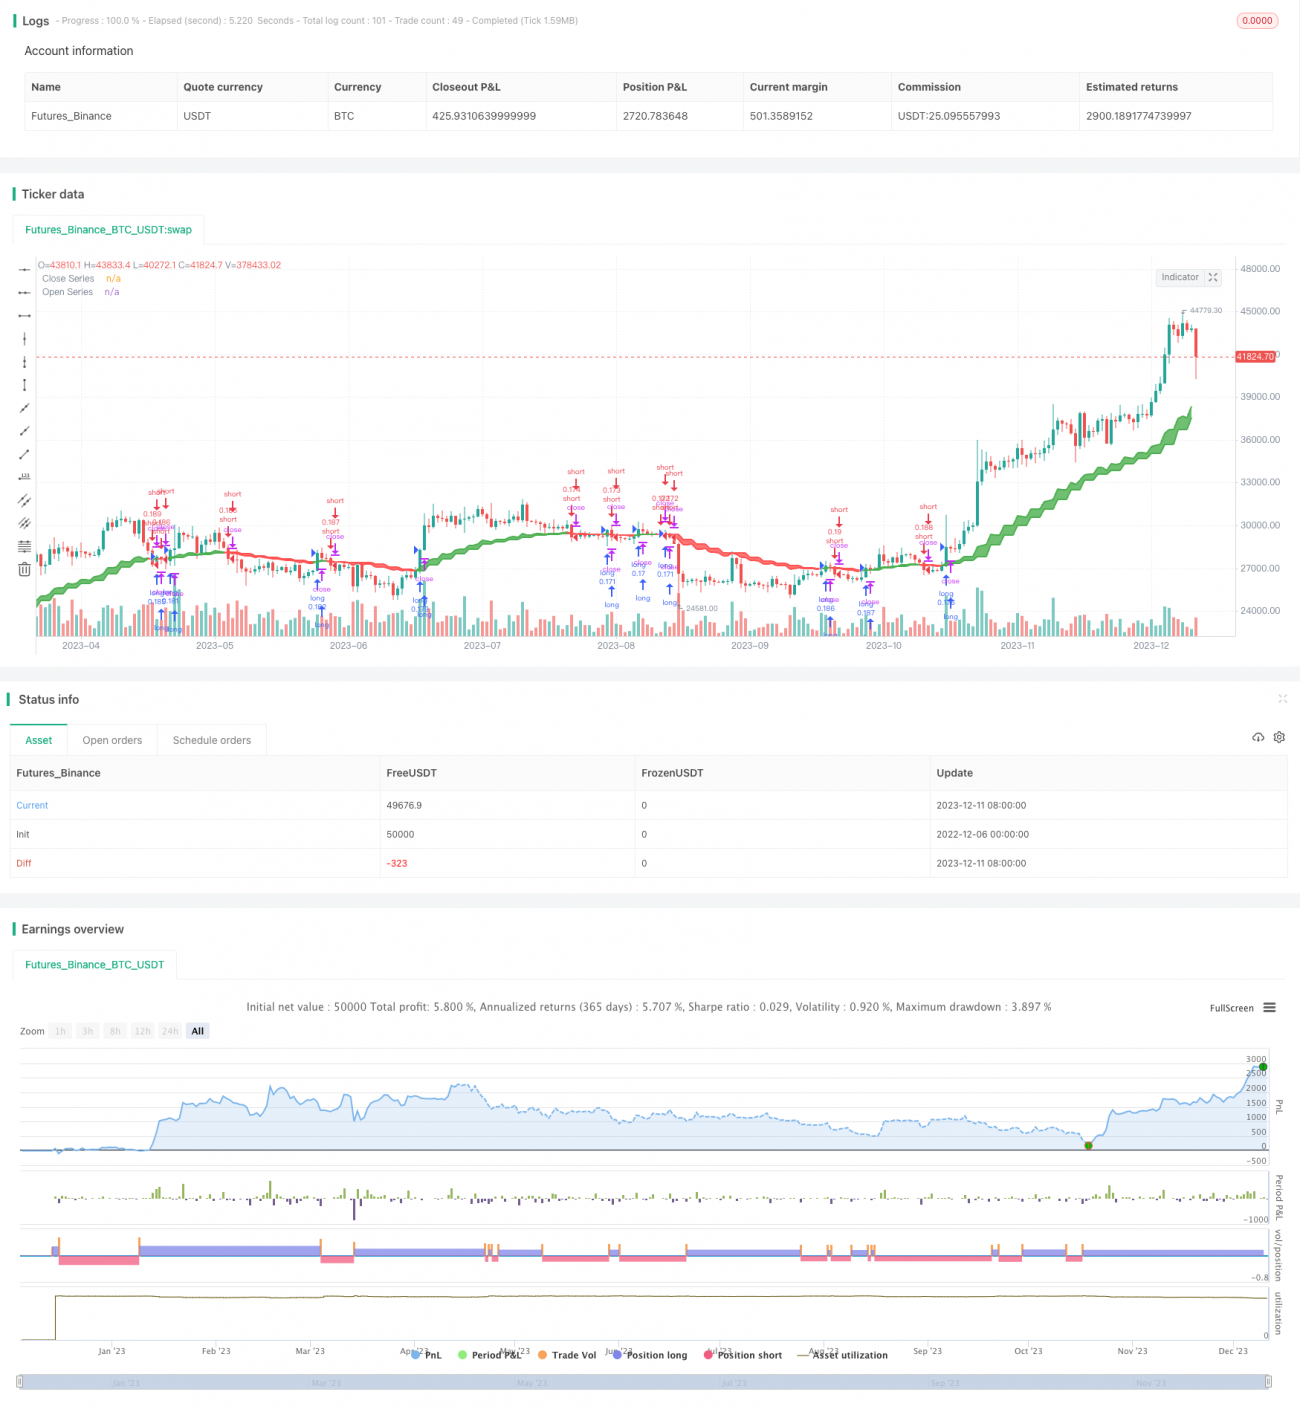
/*backtest
start: 2022-12-06 00:00:00
end: 2023-12-12 00:00:00
period: 1d
basePeriod: 1h
exchanges: [{"eid":"Futures_Binance","currency":"BTC_USDT"}]
*/
//@version=5
//
strategy(title='Open Close Cross Strategy ', shorttitle='sacinvesting', overlay=true, pyramiding=0, default_qty_type=strategy.percent_of_equity, default_qty_value=10, calc_on_every_tick=false)
// === INPUTS ===
useRes = input(defval=true, title='Use Alternate Resolution?')
intRes = input(defval=3, title='Multiplier for Alernate Resolution')
stratRes = timeframe.ismonthly ? str.tostring(timeframe.multiplier * intRes, '###M') : timeframe.isweekly ? str.tostring(timeframe.multiplier * intRes, '###W') : timeframe.isdaily ? str.tostring(timeframe.multiplier * intRes, '###D') : timeframe.isintraday ? str.tostring(timeframe.multiplier * intRes, '####') : '60'
basisType = input.string(defval='SMMA', title='MA Type: ', options=['SMA', 'EMA', 'DEMA', 'TEMA', 'WMA', 'VWMA', 'SMMA', 'HullMA', 'LSMA', 'ALMA', 'SSMA', 'TMA'])
basisLen = input.int(defval=8, title='MA Period', minval=1)
offsetSigma = input.int(defval=6, title='Offset for LSMA / Sigma for ALMA', minval=0)
offsetALMA = input.float(defval=0.85, title='Offset for ALMA', minval=0, step=0.01)
scolor = input(false, title='Show coloured Bars to indicate Trend?')
delayOffset = input.int(defval=0, title='Delay Open/Close MA (Forces Non-Repainting)', minval=0, step=1)
tradeType = input.string('BOTH', title='What trades should be taken : ', options=['LONG', 'SHORT', 'BOTH', 'NONE'])
// === /INPUTS ===
// Constants colours that include fully non-transparent option.
green100 = #008000FF
lime100 = #00FF00FF
red100 = #FF0000FF
blue100 = #0000FFFF
aqua100 = #00FFFFFF
darkred100 = #8B0000FF
gray100 = #808080FF
// === BASE FUNCTIONS ===
// Returns MA input selection variant, default to SMA if blank or typo.
variant(type, src, len, offSig, offALMA) =>
v1 = ta.sma(src, len) // Simple
v2 = ta.ema(src, len) // Exponential
v3 = 2 * v2 - ta.ema(v2, len) // Double Exponential
v4 = 3 * (v2 - ta.ema(v2, len)) + ta.ema(ta.ema(v2, len), len) // Triple Exponential
v5 = ta.wma(src, len) // Weighted
v6 = ta.vwma(src, len) // Volume Weighted
v7 = 0.0
sma_1 = ta.sma(src, len) // Smoothed
v7 := na(v7[1]) ? sma_1 : (v7[1] * (len - 1) + src) / len
v8 = ta.wma(2 * ta.wma(src, len / 2) - ta.wma(src, len), math.round(math.sqrt(len))) // Hull
v9 = ta.linreg(src, len, offSig) // Least Squares
v10 = ta.alma(src, len, offALMA, offSig) // Arnaud Legoux
v11 = ta.sma(v1, len) // Triangular (extreme smooth)
// SuperSmoother filter
// ©️ 2013 John F. Ehlers
a1 = math.exp(-1.414 * 3.14159 / len)
b1 = 2 * a1 * math.cos(1.414 * 3.14159 / len)
c2 = b1
c3 = -a1 * a1
c1 = 1 - c2 - c3
v12 = 0.0
v12 := c1 * (src + nz(src[1])) / 2 + c2 * nz(v12[1]) + c3 * nz(v12[2])
type == 'EMA' ? v2 : type == 'DEMA' ? v3 : type == 'TEMA' ? v4 : type == 'WMA' ? v5 : type == 'VWMA' ? v6 : type == 'SMMA' ? v7 : type == 'HullMA' ? v8 : type == 'LSMA' ? v9 : type == 'ALMA' ? v10 : type == 'TMA' ? v11 : type == 'SSMA' ? v12 : v1
// security wrapper for repeat calls
reso(exp, use, res) =>
security_1 = request.security(syminfo.tickerid, res, exp, gaps=barmerge.gaps_off, lookahead=barmerge.lookahead_on)
use ? security_1 : exp
// === /BASE FUNCTIONS ===
// === SERIES SETUP ===
closeSeries = variant(basisType, close[delayOffset], basisLen, offsetSigma, offsetALMA)
openSeries = variant(basisType, open[delayOffset], basisLen, offsetSigma, offsetALMA)
// === /SERIES ===
// === PLOTTING ===
// Get Alternate resolution Series if selected.
closeSeriesAlt = reso(closeSeries, useRes, stratRes)
openSeriesAlt = reso(openSeries, useRes, stratRes)
//
trendColour = closeSeriesAlt > openSeriesAlt ? color.green : color.red
bcolour = closeSeries > openSeriesAlt ? lime100 : red100
barcolor(scolor ? bcolour : na, title='Bar Colours')
closeP = plot(closeSeriesAlt, title='Close Series', color=trendColour, linewidth=2, style=plot.style_line, transp=20)
openP = plot(openSeriesAlt, title='Open Series', color=trendColour, linewidth=2, style=plot.style_line, transp=20)
fill(closeP, openP, color=trendColour, transp=80)
// === /PLOTTING ===
//
//
// === ALERT conditions
xlong = ta.crossover(closeSeriesAlt, openSeriesAlt)
xshort = ta.crossunder(closeSeriesAlt, openSeriesAlt)
longCond = xlong // alternative: longCond[1]? false : (xlong or xlong[1]) and close>closeSeriesAlt and close>=open
shortCond = xshort // alternative: shortCond[1]? false : (xshort or xshort[1]) and close<closeSeriesAlt and close<=open
// === /ALERT conditions.
// === STRATEGY ===
// stop loss
slPoints = input.int(defval=0, title='Initial Stop Loss Points (zero to disable)', minval=0)
tpPoints = input.int(defval=0, title='Initial Target Profit Points (zero for disable)', minval=0)
// Include bar limiting algorithm
ebar = input.int(defval=10000, title='Number of Bars for Back Testing', minval=0)
dummy = input(false, title='- SET to ZERO for Daily or Longer Timeframes')
//
// Calculate how many mars since last bar
tdays = (timenow - time) / 60000.0 // number of minutes since last bar
tdays := timeframe.ismonthly ? tdays / 1440.0 / 5.0 / 4.3 / timeframe.multiplier : timeframe.isweekly ? tdays / 1440.0 / 5.0 / timeframe.multiplier : timeframe.isdaily ? tdays / 1440.0 / timeframe.multiplier : tdays / timeframe.multiplier // number of bars since last bar
//
//set up exit parameters
TP = tpPoints > 0 ? tpPoints : na
SL = slPoints > 0 ? slPoints : na
// Make sure we are within the bar range, Set up entries and exit conditions
if (ebar == 0 or tdays <= ebar) and tradeType != 'NONE'
strategy.entry('long', strategy.long, when=longCond == true and tradeType != 'SHORT')
strategy.entry('short', strategy.short, when=shortCond == true and tradeType != 'LONG')
strategy.close('long', when=shortCond == true and tradeType == 'LONG')
strategy.close('short', when=longCond == true and tradeType == 'SHORT')
strategy.exit('XL', from_entry='long', profit=TP, loss=SL)
strategy.exit('XS', from_entry='short', profit=TP, loss=SL)
// === /STRATEGY ===
// eof