Strategi Mengikuti Pelarian

Gambaran keseluruhan
Idea utama strategi ini adalah untuk mengenal pasti arah trend pada bingkai masa yang lebih besar dan mencari titik masuk terobosan pada bingkai masa yang lebih kecil, dan berhenti keluar mengesan purata bergerak pada bingkai masa yang lebih besar.
Prinsip Strategi
Strategi ini dibuat berdasarkan tiga penunjuk utama:
Pertama, mengira purata bergerak mudah X hari untuk tempoh yang lebih lama (seperti garis matahari), dan hanya membenarkan pembelian apabila purata bergerak itu berada di stesen harga. Ini boleh digunakan untuk menentukan arah trend keseluruhan dan mengelakkan tempoh goyah perdagangan.
Kedua, mengira harga tertinggi dalam tempoh yang lebih pendek (seperti 5 hari) Swing High, yang akan mencetuskan isyarat beli apabila harga menembusi harga tertinggi tersebut. Di sini, ia digabungkan dengan parameter lb untuk mencari titik pecah yang sesuai.
Ketiga, menubuhkan garis berhenti. Selepas memasuki kedudukan, garis berhenti dikunci pada harga terendah lbStop dalam tempoh tertentu dari titik rendah terdekat. Pada masa yang sama, menetapkan purata bergerak ((seperti EMA 10 hari hari) sebagai mekanisme keluar, keluar dari kedudukan apabila harga lebih rendah daripada purata bergerak tersebut.
Strategi ini juga menetapkan nilai ATR untuk mengelakkan pembelian tempat yang terlalu banyak. Selain itu, terdapat syarat tambahan seperti jangka masa pengukuran.
Pertimbangan antara ketiga-tiga penunjuk ini membentuk logik utama strategi ini.
Analisis kelebihan strategi
Ini adalah strategi penembusan yang mempunyai beberapa kelebihan:
-
Menggunakan dua bingkai masa untuk mengelakkan diri daripada terjebak dalam pasaran yang bergolak. Bingkai masa yang lebih panjang untuk menilai trend keseluruhan, bingkai masa yang lebih pendek untuk mencari titik masuk tertentu.
-
Dengan menggunakan titik penembusan yang terbentuk oleh swing high, jenis penembusan ini mempunyai inersia dan mudah untuk dijejaki. Pada masa yang sama, parameter lb kitaran boleh disesuaikan untuk mencari penembusan yang benar-benar berkesan.
-
Hentikan kerosakan adalah lebih ketat, menjejaki titik rendah terkini dan meninggalkan jarak pelindung tertentu untuk mengelakkan penarikan.
-
Menggunakan purata bergerak sebagai mekanisme keluar, ia boleh dihentikan secara fleksibel mengikut keadaan.
-
Indeks ATR mengelakkan risiko yang disebabkan oleh pelepasan berlebihan.
-
Anda boleh menetapkan kombinasi parameter yang berbeza untuk menguji kesannya, ruang untuk pengoptimuman yang lebih besar.
Analisis risiko
Strategi ini juga mempunyai risiko:
-
Apabila harga bergoyang naik dan turun berhampiran dengan purata bergerak, ia mudah untuk bertukar masuk dan keluar dari kedudukan berulang kali. Ia akan menghadapi risiko yuran bayaran yang lebih tinggi.
-
Apabila titik beli pecah berhampiran dengan purata bergerak, terdapat risiko pulangan yang lebih besar. Ini adalah ciri strategi itu sendiri.
-
Apabila pasaran tidak mempunyai trend yang jelas, jangka masa yang terlalu lama boleh menyebabkan risiko masa.
-
Parameter ATR perlu ditetapkan dengan munasabah. Jika ATR terlalu kecil, penapisan akan kurang berkesan, dan jika terlalu besar, peluang masuk akan berkurangan.
-
Perlu menguji kesan parameter lb yang berbeza terhadap keputusan. Parameter yang terlalu besar akan kehilangan beberapa peluang, dan parameter yang terlalu kecil mungkin mengenal pasti penembusan palsu.
Penyelesaian risiko:
- Menyesuaikan parameter purata bergerak dengan betul, menambah kesan penapisan.
- Mengoptimumkan parameter ATR dan membuat penilaian visual.
- Sesuaikan kembali peredaran lb untuk mencari parameter terbaik.
- Berhenti berniaga dalam keadaan gegaran.
Arah pengoptimuman strategi
Strategi ini juga boleh dioptimumkan dari dimensi berikut:
-
Uji kombinasi parameter purata bergerak yang berbeza untuk mencari parameter terbaik.
-
Cuba seting parameter ATR yang berbeza untuk mengimbangi peluang masuk dan kawalan risiko.
-
Optimumkan kembali parameter lb untuk mengenal pasti penembusan yang lebih cekap.
-
Cuba bina stop loss dinamik, mengawal risiko mengikut kadar turun naik dan penarikan balik.
-
Kesan penembusan digabungkan dengan faktor-faktor lain seperti indikator jumlah dagangan.
-
Membangunkan kaedah untuk mencari titik-titik kritikal sebagai rujukan.
-
Cuba Machine Learning untuk melatih parameter untuk mendapatkan parameter yang optimum
ringkaskan
Strategi ini secara keseluruhan adalah strategi pelacakan terobosan yang tipikal. Penghakiman bingkai masa ganda, Swing High mengenal pasti masa masuk, stop loss line, dan pergerakan rata-rata mekanisme pelacakan keluar, membentuk sistem logik yang lengkap. Strategi ini mempunyai ciri risiko dan keuntungan yang jelas, sesuai untuk pelabur yang mengikuti jenis garis panjang dan sederhana. Walaupun terdapat risiko tertentu, tahap risiko dapat dikurangkan dengan pengoptimuman parameter dan pengoptimuman peraturan.
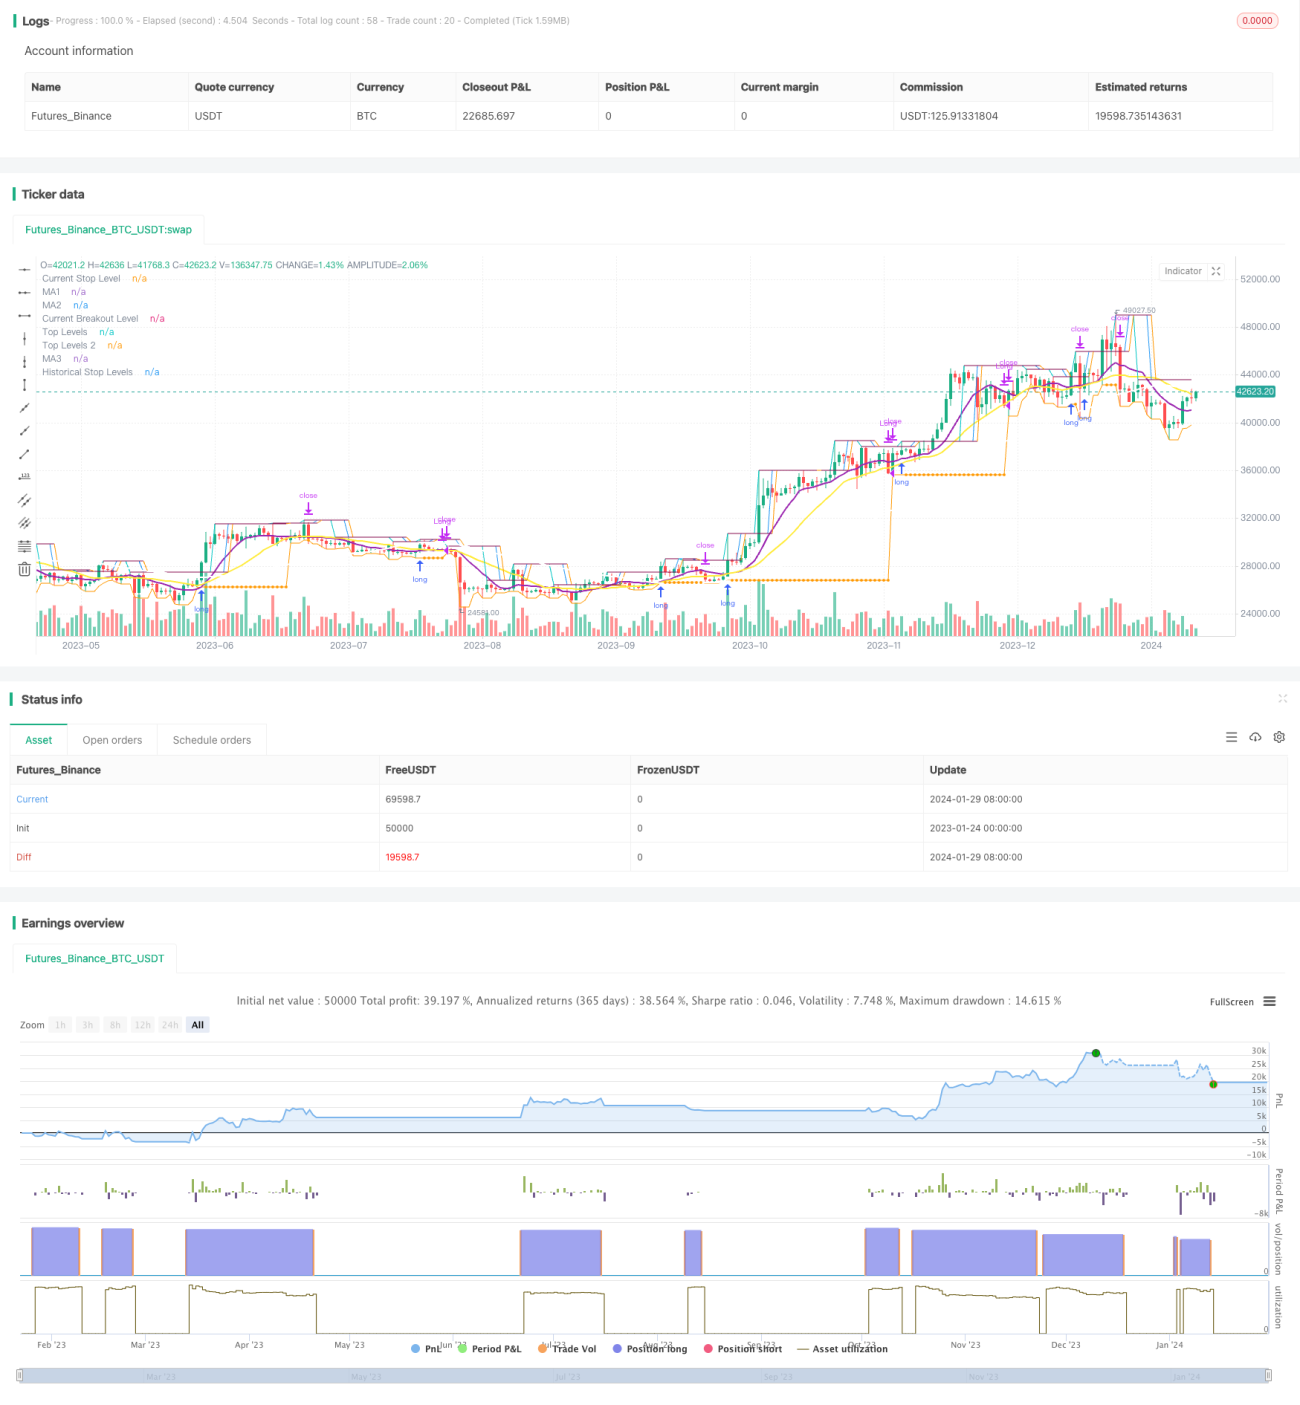
/*backtest
start: 2023-01-24 00:00:00
end: 2024-01-30 00:00:00
period: 1d
basePeriod: 1h
exchanges: [{"eid":"Futures_Binance","currency":"BTC_USDT"}]
*/

// This source code is subject to the terms of the Mozilla Public License 2.0 at https://mozilla.org/MPL/2.0/
// © millerrh

// The intent of this strategy is to buy breakouts with a tight stop on smaller timeframes in the direction of the longer term trend.- 1