Estratégia de monitoramento de momentum em todos os períodos de tempo
Visão geral
Esta estratégia permite o acompanhamento da dinâmica de um quadro de tempo através da combinação de um retorno de 123 e um indicador MACD. O retorno de 123 determina o ponto de retorno de uma tendência de curto prazo e o MACD determina a tendência de médio e longo prazo, ambos combinados para alcançar um sinal positivo de tendência de médio e longo prazo ao mesmo tempo em que bloqueiam a reversão de curto prazo.
Princípio da estratégia
A estratégia consiste em duas partes:
123 Reversão: As duas linhas K atuais formam um ponto alto/baixo e geram um sinal de compra/venda quando o indicador aleatório está abaixo/acima de 50.
Parte do MACD: O sinal de compra é gerado quando a linha rápida atravessa a linha lenta, e o sinal de venda é gerado quando a linha rápida atravessa a linha lenta.
A combinação das duas, ou seja, quando o MACD gera um sinal de sincronia ao mesmo tempo em que o 123 inverte, emite um sinal final.
Análise de vantagens
A estratégia combina reversão de curto prazo e tendências de médio e longo prazo, que podem ser bloqueados em curto prazo oscilação de tendências de médio e longo prazo, para obter uma maior taxa de vitória. Especialmente em situações de turbulência, pode ser eliminado por meio de 123 reversão de alguns ruídos, para melhorar a estabilidade.
Além disso, pode-se ajustar os parâmetros para equilibrar a proporção de sinais de inversão e de tendência, adaptando-se a diferentes condições de mercado.
Análise de Riscos
A estratégia tem um certo atraso de tempo, especialmente quando se usa um MACD de longo período, podendo perder o trânsito de curto prazo. Além disso, o sinal de inversão em si tem um certo grau de aleatoriedade, sendo fácil de ser capturado.
Pode ser apropriadamente reduzido o ciclo MACD, ou aumentado o stop loss para controlar o risco.
Direção de otimização
A estratégia pode ser melhorada em vários aspectos:
Ajustar 123 parâmetros de inversão para otimizar o efeito de inversão
Ajustar os parâmetros MACD para otimizar o julgamento de tendências
Adicionar filtros de outros indicadores auxiliares para melhorar a eficácia
Aumentar as estratégias de prevenção de perdas e controlar os riscos
Resumir
Esta estratégia integra vários parâmetros e indicadores técnicos em vários períodos de tempo, traçando a dinâmica entre os períodos de tempo, equilibrando as vantagens de inverter a negociação e a negociação de tendências. Pode ajustar o efeito de equilíbrio através dos parâmetros e pode introduzir mais indicadores ou parar para otimizar, é uma idéia estratégica muito potencial.
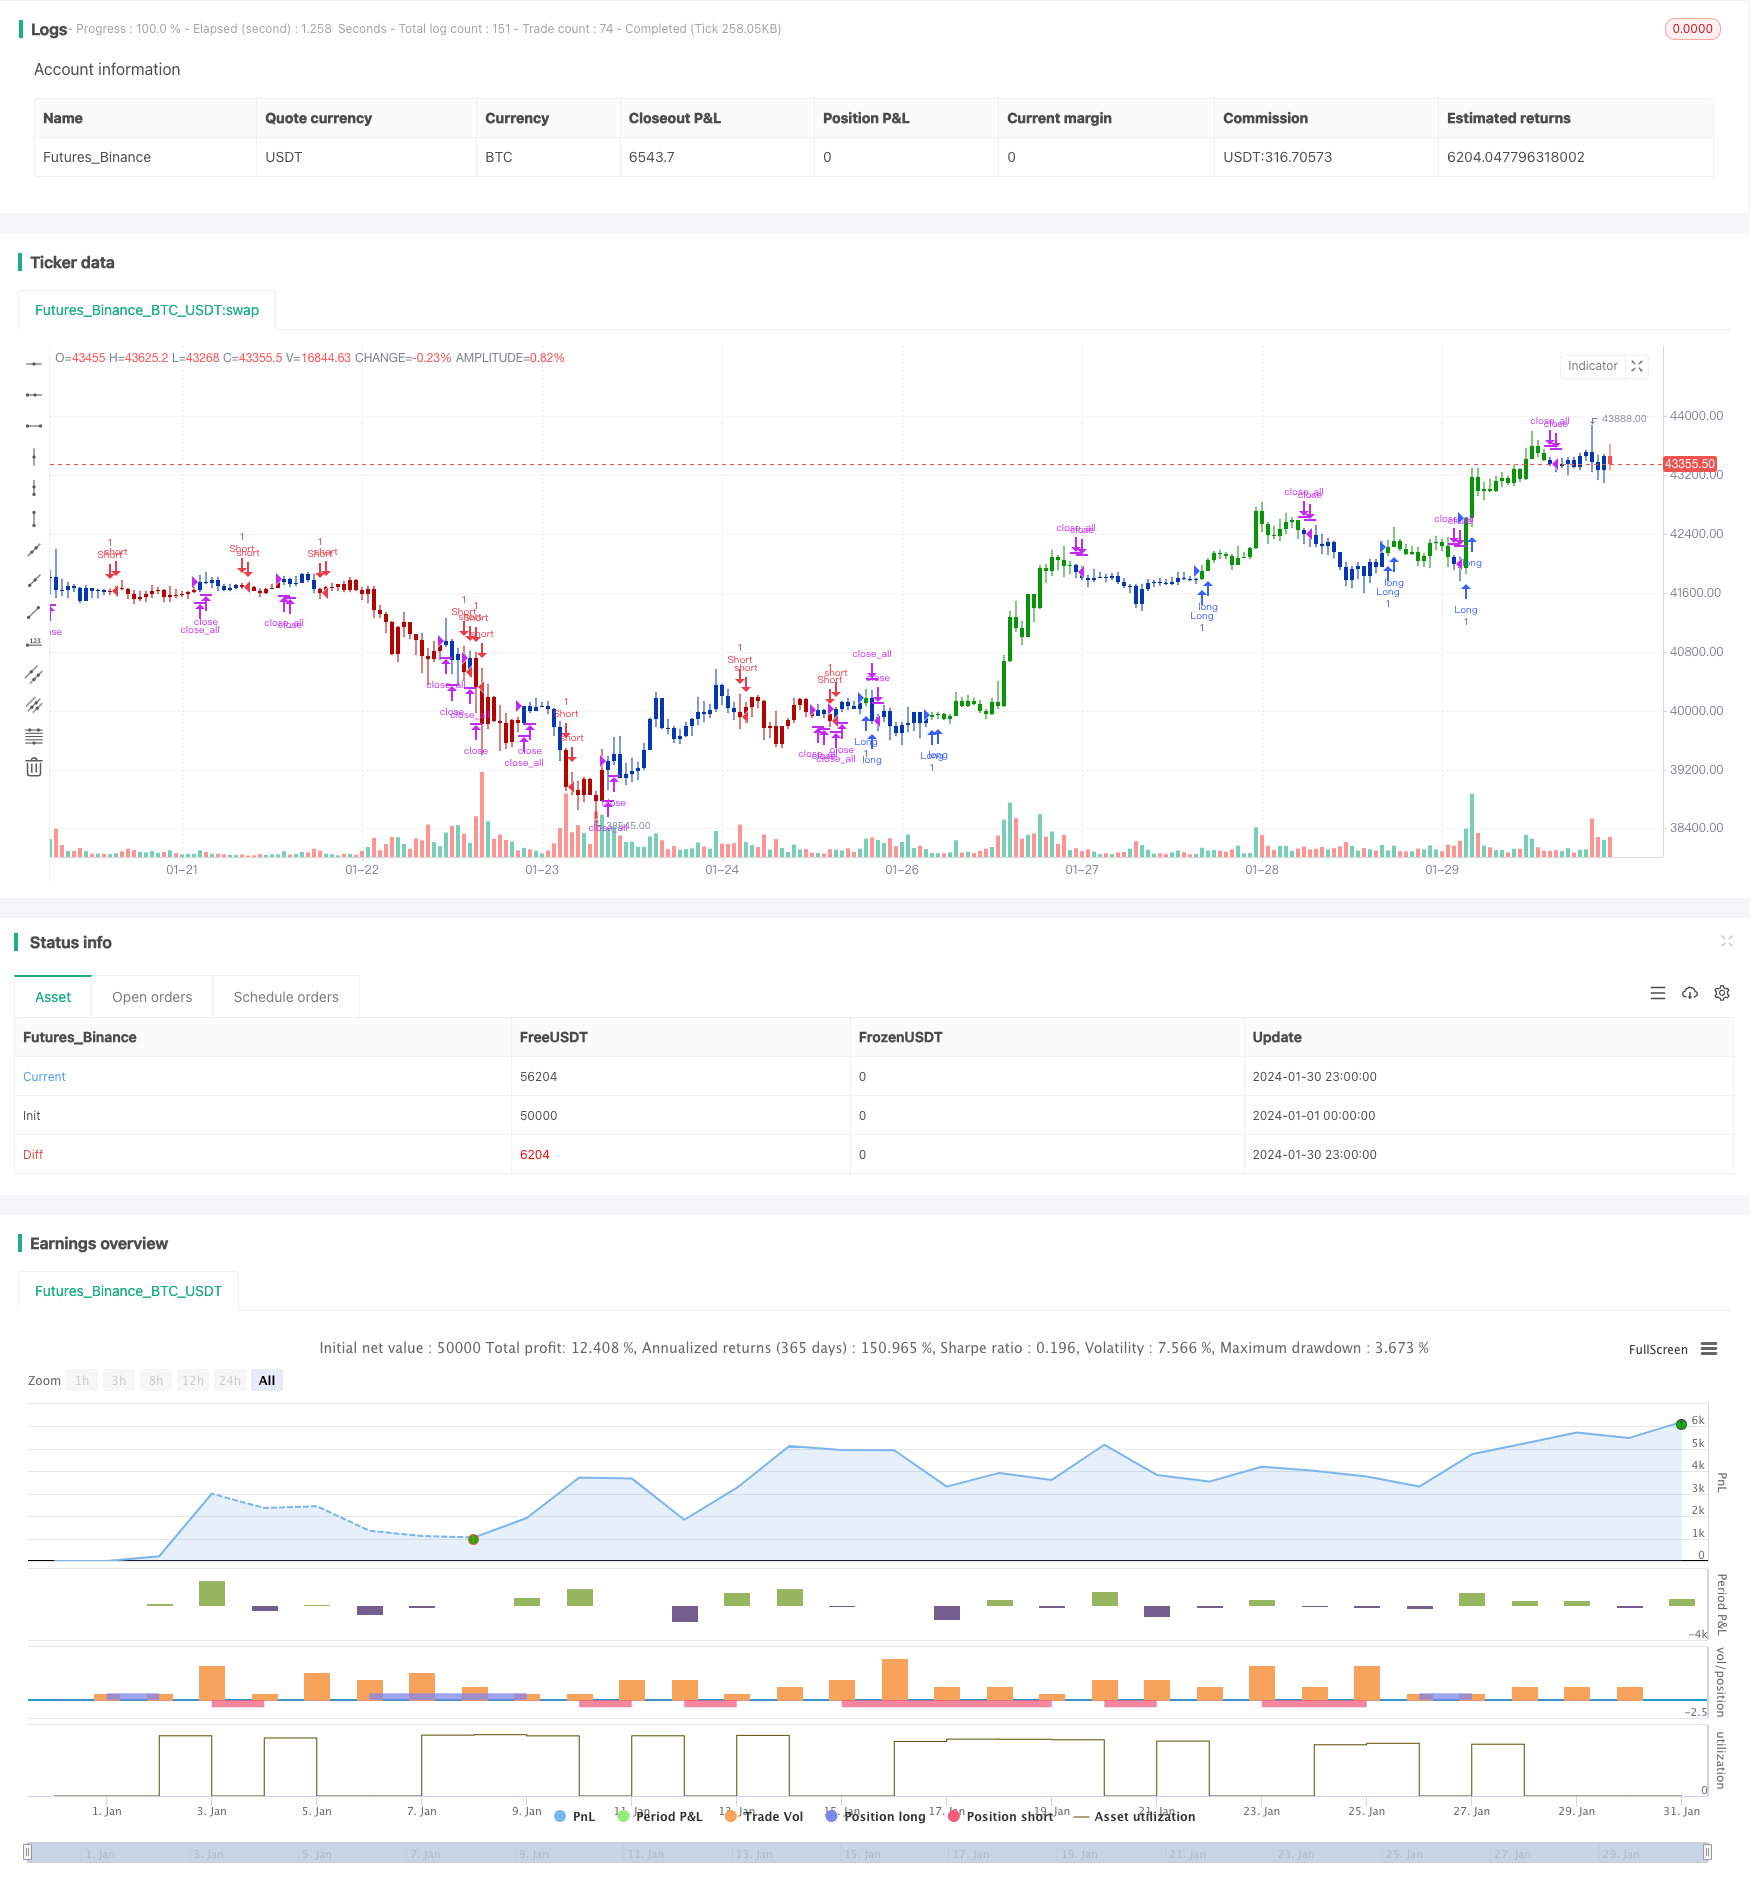
/*backtest
start: 2024-01-01 00:00:00
end: 2024-01-31 00:00:00
period: 1h
basePeriod: 15m
exchanges: [{"eid":"Futures_Binance","currency":"BTC_USDT"}]
*/

//@version=4
////////////////////////////////////////////////////////////
//  Copyright by HPotter v1.0 28/01/2021
// This is combo strategies for get a cumulative signal.
//
// First strategy
// This System was created from the Book "How I Tripled My Money In The
// Futures Market" by Ulf Jensen, Page 183. This is reverse type of strategies.
// The strategy buys at market, if close price is higher than the previous close
// during 2 days and the meaning of 9-days Stochastic Slow Oscillator is lower than 50.
// The strategy sells at market, if close price is lower than the previous close price
// during 2 days and the meaning of 9-days Stochastic Fast Oscillator is higher than 50.
//
// Second strategy
// MACD – Moving Average Convergence Divergence. The MACD is calculated
// by subtracting a 26-day moving average of a security's price from a
// 12-day moving average of its price. The result is an indicator that
// oscillates above and below zero. When the MACD is above zero, it means
// the 12-day moving average is higher than the 26-day moving average.
// This is bullish as it shows that current expectations (i.e., the 12-day
// moving average) are more bullish than previous expectations (i.e., the
// 26-day average). This implies a bullish, or upward, shift in the supply/demand
// lines. When the MACD falls below zero, it means that the 12-day moving average
// is less than the 26-day moving average, implying a bearish shift in the
// supply/demand lines.
// A 9-day moving average of the MACD (not of the security's price) is usually
// plotted on top of the MACD indicator. This line is referred to as the "signal"
// line. The signal line anticipates the convergence of the two moving averages
// (i.e., the movement of the MACD toward the zero line).
// Let's consider the rational behind this technique. The MACD is the difference
// between two moving averages of price. When the shorter-term moving average rises
// above the longer-term moving average (i.e., the MACD rises above zero), it means
// that investor expectations are becoming more bullish (i.e., there has been an
// upward shift in the supply/demand lines). By plotting a 9-day moving average of
// the MACD, we can see the changing of expectations (i.e., the shifting of the
// supply/demand lines) as they occur.
//
// WARNING:
// - For purpose educate only
// - This script to change bars colors.
////////////////////////////////////////////////////////////
Reversal123(Length, KSmoothing, DLength, Level) =>
    vFast = sma(stoch(close, high, low, Length), KSmoothing)
    vSlow = sma(vFast, DLength)
    pos = 0.0
    pos := iff(close[2] < close[1] and close > close[1] and vFast < vSlow and vFast > Level, 1,
	         iff(close[2] > close[1] and close < close[1] and vFast > vSlow and vFast < Level, -1, nz(pos[1], 0)))
	pos

MACD(fastLength,slowLength,signalLength) =>
    pos = 0.0
    fastMA = ema(close, fastLength)
    slowMA = ema(close, slowLength)
    macd = fastMA - slowMA
    signal = sma(macd, signalLength)
    pos:= iff(signal < macd , 1,
	       iff(signal > macd, -1, nz(pos[1], 0)))
    pos

strategy(title="Combo Backtest 123 Reversal & MACD Crossover", shorttitle="Combo", overlay = true)
line1 = input(true, "---- 123 Reversal ----")
Length = input(14, minval=1)
KSmoothing = input(1, minval=1)
DLength = input(3, minval=1)
Level = input(50, minval=1)
//-------------------------
fastLength = input(8, minval=1)
slowLength = input(16,minval=1)
signalLength=input(11,minval=1)
xSeria = input(title="Source", type=input.source, defval=close)
reverse = input(false, title="Trade reverse")
posReversal123 = Reversal123(Length, KSmoothing, DLength, Level)
posMACD = MACD(fastLength,slowLength, signalLength)
pos = iff(posReversal123 == 1 and posMACD == 1 , 1,
	   iff(posReversal123 == -1 and posMACD == -1, -1, 0))
possig = iff(reverse and pos == 1, -1,
          iff(reverse and pos == -1 , 1, pos))
if (possig == 1)
    strategy.entry("Long", strategy.long)
if (possig == -1)
    strategy.entry("Short", strategy.short)
if (possig == 0)
    strategy.close_all()
barcolor(possig == -1 ? #b50404: possig == 1 ? #079605 : #0536b3 )