
Двухлинейная пересекающаяся точечная стратегия - это количественная торговая стратегия, основанная на движущихся средних. Она определяет ценовые тенденции, рассчитывая пересечение быстрых и медленных линий, и посылает сигналы покупки и продажи на пересечении.
Формула расчета для стратегии бинарного пересечения равнолинейных точек выглядит следующим образом:
Быстрая линия (средняя линия корпуса): WMA (n/2) * WMA (n/2) - WMA (n), SQRT (n))
Super Smoother: три раза фильтр
Среди них, WMA - весовая скользящая средняя, SQRT - открытый квадратный корень, фильтр содержит один однофазный и два второфазных задержки.
Стратегия определяет перекрестную связь между двумя линиями, рассчитывая значения быстрого и медленного направления, в том числе:
Проезжая по скоростной линии, вы получаете сигнал о покупке.
Быстрый сигнал вниз, медленный сигнал вниз.
Двухлинейная кросс-пойнт-стратегия, сочетающая в себе преимущества двойного равнолинейного суждения и точечной торговли, позволяет точно уловить поворотные моменты тренда и вовремя выйти на рынок. По сравнению с одной однолинейной стратегией, она имеет следующие преимущества:
Однако есть и риск, связанный с двулинейным пересечением:
Стратегия бинарного пересечения может быть оптимизирована в следующих аспектах:
Двухлинейная кросс-пунктная стратегия наследует преимущества однолинейной стратегии, расширяет применение двухлинейных суждений и методов точечной торговли, образуя более продвинутую и надежную количественную торговую программу. Она обладает уникальными преимуществами в выборе времени торговли, которые заслуживают проверки и исследования применения.
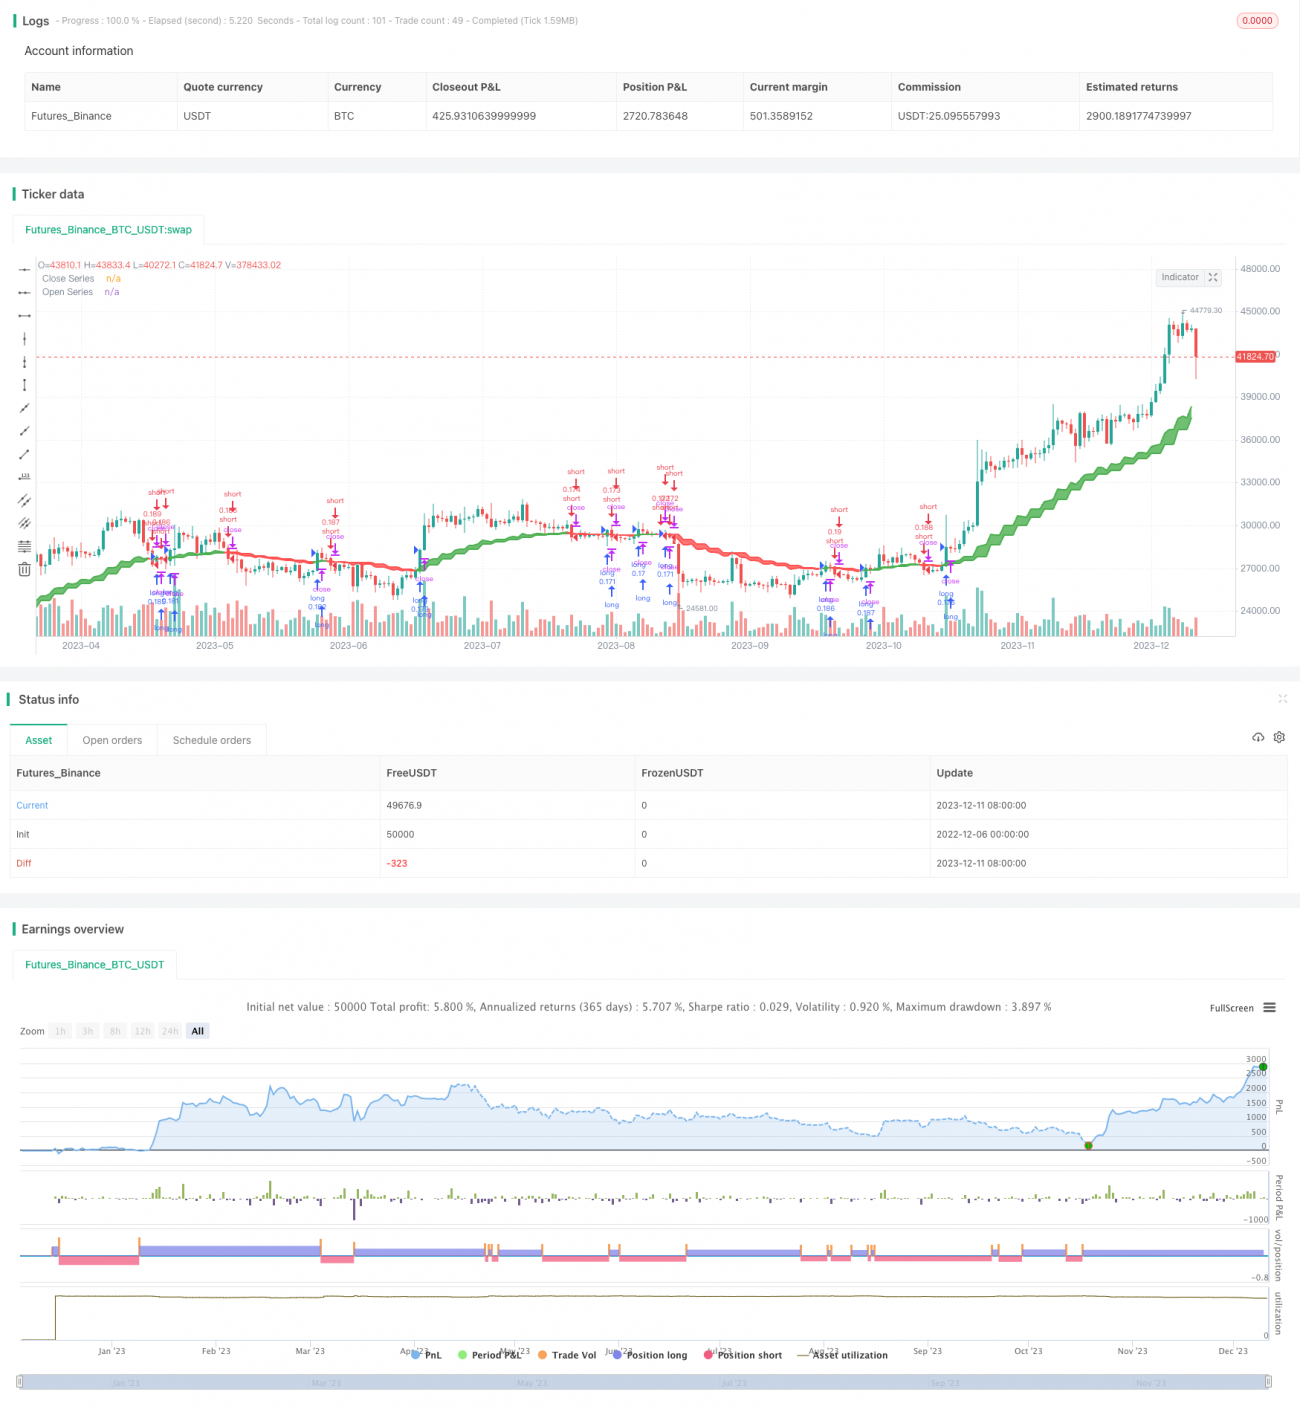
/*backtest
start: 2022-12-06 00:00:00
end: 2023-12-12 00:00:00
period: 1d
basePeriod: 1h
exchanges: [{"eid":"Futures_Binance","currency":"BTC_USDT"}]
*/
//@version=5
//
strategy(title='Open Close Cross Strategy ', shorttitle='sacinvesting', overlay=true, pyramiding=0, default_qty_type=strategy.percent_of_equity, default_qty_value=10, calc_on_every_tick=false)
// === INPUTS ===
useRes = input(defval=true, title='Use Alternate Resolution?')
intRes = input(defval=3, title='Multiplier for Alernate Resolution')
stratRes = timeframe.ismonthly ? str.tostring(timeframe.multiplier * intRes, '###M') : timeframe.isweekly ? str.tostring(timeframe.multiplier * intRes, '###W') : timeframe.isdaily ? str.tostring(timeframe.multiplier * intRes, '###D') : timeframe.isintraday ? str.tostring(timeframe.multiplier * intRes, '####') : '60'
basisType = input.string(defval='SMMA', title='MA Type: ', options=['SMA', 'EMA', 'DEMA', 'TEMA', 'WMA', 'VWMA', 'SMMA', 'HullMA', 'LSMA', 'ALMA', 'SSMA', 'TMA'])
basisLen = input.int(defval=8, title='MA Period', minval=1)
offsetSigma = input.int(defval=6, title='Offset for LSMA / Sigma for ALMA', minval=0)
offsetALMA = input.float(defval=0.85, title='Offset for ALMA', minval=0, step=0.01)
scolor = input(false, title='Show coloured Bars to indicate Trend?')
delayOffset = input.int(defval=0, title='Delay Open/Close MA (Forces Non-Repainting)', minval=0, step=1)
tradeType = input.string('BOTH', title='What trades should be taken : ', options=['LONG', 'SHORT', 'BOTH', 'NONE'])
// === /INPUTS ===
// Constants colours that include fully non-transparent option.
green100 = #008000FF
lime100 = #00FF00FF
red100 = #FF0000FF
blue100 = #0000FFFF
aqua100 = #00FFFFFF
darkred100 = #8B0000FF
gray100 = #808080FF
// === BASE FUNCTIONS ===
// Returns MA input selection variant, default to SMA if blank or typo.
variant(type, src, len, offSig, offALMA) =>
v1 = ta.sma(src, len) // Simple
v2 = ta.ema(src, len) // Exponential
v3 = 2 * v2 - ta.ema(v2, len) // Double Exponential
v4 = 3 * (v2 - ta.ema(v2, len)) + ta.ema(ta.ema(v2, len), len) // Triple Exponential
v5 = ta.wma(src, len) // Weighted
v6 = ta.vwma(src, len) // Volume Weighted
v7 = 0.0
sma_1 = ta.sma(src, len) // Smoothed
v7 := na(v7[1]) ? sma_1 : (v7[1] * (len - 1) + src) / len
v8 = ta.wma(2 * ta.wma(src, len / 2) - ta.wma(src, len), math.round(math.sqrt(len))) // Hull
v9 = ta.linreg(src, len, offSig) // Least Squares
v10 = ta.alma(src, len, offALMA, offSig) // Arnaud Legoux
v11 = ta.sma(v1, len) // Triangular (extreme smooth)
// SuperSmoother filter
// ©️ 2013 John F. Ehlers
a1 = math.exp(-1.414 * 3.14159 / len)
b1 = 2 * a1 * math.cos(1.414 * 3.14159 / len)
c2 = b1
c3 = -a1 * a1
c1 = 1 - c2 - c3
v12 = 0.0
v12 := c1 * (src + nz(src[1])) / 2 + c2 * nz(v12[1]) + c3 * nz(v12[2])
type == 'EMA' ? v2 : type == 'DEMA' ? v3 : type == 'TEMA' ? v4 : type == 'WMA' ? v5 : type == 'VWMA' ? v6 : type == 'SMMA' ? v7 : type == 'HullMA' ? v8 : type == 'LSMA' ? v9 : type == 'ALMA' ? v10 : type == 'TMA' ? v11 : type == 'SSMA' ? v12 : v1
// security wrapper for repeat calls
reso(exp, use, res) =>
security_1 = request.security(syminfo.tickerid, res, exp, gaps=barmerge.gaps_off, lookahead=barmerge.lookahead_on)
use ? security_1 : exp
// === /BASE FUNCTIONS ===
// === SERIES SETUP ===
closeSeries = variant(basisType, close[delayOffset], basisLen, offsetSigma, offsetALMA)
openSeries = variant(basisType, open[delayOffset], basisLen, offsetSigma, offsetALMA)
// === /SERIES ===
// === PLOTTING ===
// Get Alternate resolution Series if selected.
closeSeriesAlt = reso(closeSeries, useRes, stratRes)
openSeriesAlt = reso(openSeries, useRes, stratRes)
//
trendColour = closeSeriesAlt > openSeriesAlt ? color.green : color.red
bcolour = closeSeries > openSeriesAlt ? lime100 : red100
barcolor(scolor ? bcolour : na, title='Bar Colours')
closeP = plot(closeSeriesAlt, title='Close Series', color=trendColour, linewidth=2, style=plot.style_line, transp=20)
openP = plot(openSeriesAlt, title='Open Series', color=trendColour, linewidth=2, style=plot.style_line, transp=20)
fill(closeP, openP, color=trendColour, transp=80)
// === /PLOTTING ===
//
//
// === ALERT conditions
xlong = ta.crossover(closeSeriesAlt, openSeriesAlt)
xshort = ta.crossunder(closeSeriesAlt, openSeriesAlt)
longCond = xlong // alternative: longCond[1]? false : (xlong or xlong[1]) and close>closeSeriesAlt and close>=open
shortCond = xshort // alternative: shortCond[1]? false : (xshort or xshort[1]) and close<closeSeriesAlt and close<=open
// === /ALERT conditions.
// === STRATEGY ===
// stop loss
slPoints = input.int(defval=0, title='Initial Stop Loss Points (zero to disable)', minval=0)
tpPoints = input.int(defval=0, title='Initial Target Profit Points (zero for disable)', minval=0)
// Include bar limiting algorithm
ebar = input.int(defval=10000, title='Number of Bars for Back Testing', minval=0)
dummy = input(false, title='- SET to ZERO for Daily or Longer Timeframes')
//
// Calculate how many mars since last bar
tdays = (timenow - time) / 60000.0 // number of minutes since last bar
tdays := timeframe.ismonthly ? tdays / 1440.0 / 5.0 / 4.3 / timeframe.multiplier : timeframe.isweekly ? tdays / 1440.0 / 5.0 / timeframe.multiplier : timeframe.isdaily ? tdays / 1440.0 / timeframe.multiplier : tdays / timeframe.multiplier // number of bars since last bar
//
//set up exit parameters
TP = tpPoints > 0 ? tpPoints : na
SL = slPoints > 0 ? slPoints : na
// Make sure we are within the bar range, Set up entries and exit conditions
if (ebar == 0 or tdays <= ebar) and tradeType != 'NONE'
strategy.entry('long', strategy.long, when=longCond == true and tradeType != 'SHORT')
strategy.entry('short', strategy.short, when=shortCond == true and tradeType != 'LONG')
strategy.close('long', when=shortCond == true and tradeType == 'LONG')
strategy.close('short', when=longCond == true and tradeType == 'SHORT')
strategy.exit('XL', from_entry='long', profit=TP, loss=SL)
strategy.exit('XS', from_entry='short', profit=TP, loss=SL)
// === /STRATEGY ===
// eof