Стратегия прорыва

Обзор
Основная идея этой стратегии заключается в том, чтобы идентифицировать направление тенденции на более крупных временных рамках и находить точки прорыва на более мелких временных рамках, а стоп-экзит отслеживает движущиеся средние на более крупных временных рамках.
Стратегический принцип
Эта стратегия основана на трех показателях:
Во-первых, рассчитывая X-дневную простую скользящую среднюю на более длительный период (например, солнечную линию), покупать разрешается только тогда, когда эта скользящая средняя находится на ценовом участке. Это может быть использовано для определения направления общей тенденции и избежания периодов колебаний торговли.
Во-вторых, рассчитывается максимальная цена Swing High в течение более короткого периода (например, 5 дней), когда цена превышает эту максимальную цену, что вызывает сигнал покупки. Здесь в сочетании с циклическим параметром lb для поиска подходящей точки прорыва.
В-третьих, создать линию стоп-убытков. После входа в позицию линия стоп-убытков замыкается на минимальной цене определенного цикла lbStop, находящейся на расстоянии от ближайшего минимума. При этом устанавливается движущаяся средняя (например, 10-дневная ЭМА на солнечной линии) в качестве механизма выхода из позиции, когда цена ниже этой движущейся средней.
В этой стратегии также устанавливается значение ATR, чтобы избежать покупки избыточного количества точек. Кроме того, существуют другие дополнительные условия, такие как диапазон времени отсчета.
Взаимодействие этих трех показателей формирует центральную логику этой стратегии.
Анализ преимуществ стратегии
Это прорывная стратегия слежения, обладающая следующими преимуществами:
-
Используйте две временные рамки, чтобы избежать ложных прорывов в волатильных рынках. Более длинные временные рамки - для оценки общей тенденции, более короткие - для поиска конкретных точек входа.
-
С помощью прорывов, сформированных с помощью Swing High, такие прорывы имеют определенную инерцию и легко формируют отслеживание. При этом можно скорректировать параметр lb для поиска действительно эффективных прорывов.
-
Стойкость к убыткам является более строгой, она отслеживает недавние низкие точки и оставляет определенную буферную дистанцию, чтобы избежать потери.
-
Использование скользящих средних как механизма выхода позволяет гибко останавливать прибыль в зависимости от ситуации.
-
Показатель ATR позволяет избежать рисков, связанных с избыточным выбросом.
-
Можно установить различные комбинации параметров для тестирования эффекта, есть большой простор для оптимизации.
Анализ рисков
Однако эта стратегия несет в себе определенные риски:
-
Когда цена колеблется вверх и вниз вблизи скользящего среднего, она может быть переключена вверх и вниз. При этом существует риск более высоких комиссионных.
-
При прорыве точки покупки, близкой к движущейся средней, существует более высокий риск вывода. Это свойственно самой стратегии.
-
Если рынок не имеет явных тенденций, то долгое время может быть слишком длительным, что создает риски.
-
Необходимо разумно установить параметры ATR. Если ATR слишком маленький, фильтрация будет слабой, а если он слишком большой, то шансы на поступление будут уменьшены.
-
Необходимо проверить влияние различных параметров lb на результаты. Слишком большие параметры могут пропустить часть возможностей, слишком маленькие параметры могут идентифицировать ложные прорывы.
Решение риска:
- Устройство параметров скользящих средних для повышения эффекта фильтрации.
- Оптимизация параметров ATR и визуальное оценивание.
- Настройка возвращается на цикл lb, чтобы найти оптимальные параметры.
- Приостановка торговли в условиях потрясений.
Направление оптимизации стратегии
Эта стратегия также может быть оптимизирована в следующих аспектах:
-
Тестирование различных комбинаций параметров для поиска оптимального значения для скользящей средней.
-
Попробуйте различные параметры ATR, чтобы сбалансировать возможности входа и контроль риска.
-
Оптимизируйте обратный цикл lb для выявления более эффективных прорывов.
-
Попытка создания динамического стоп-ущерба, с учетом риска волатильности и снятия.
-
Эффективность прорыва оценивается в сочетании с другими факторами, такими как показатель объема торгов.
-
Разработать методы поиска критических точек в качестве ориентира.
-
Попробуйте Machine Learning для обучения параметров, чтобы получить оптимальные параметры
Подвести итог
Стратегия в целом является типичной стратегией отслеживания прорыва. Судьба двойных временных рамок, Swing High, идентифицирующая входный момент, стоп-линию и двойную страховку для выхода из движущейся средней, образует целостную логическую систему. Характеристика риска и прибыли стратегии более четкая и подходит для инвесторов среднего и длинного типа.
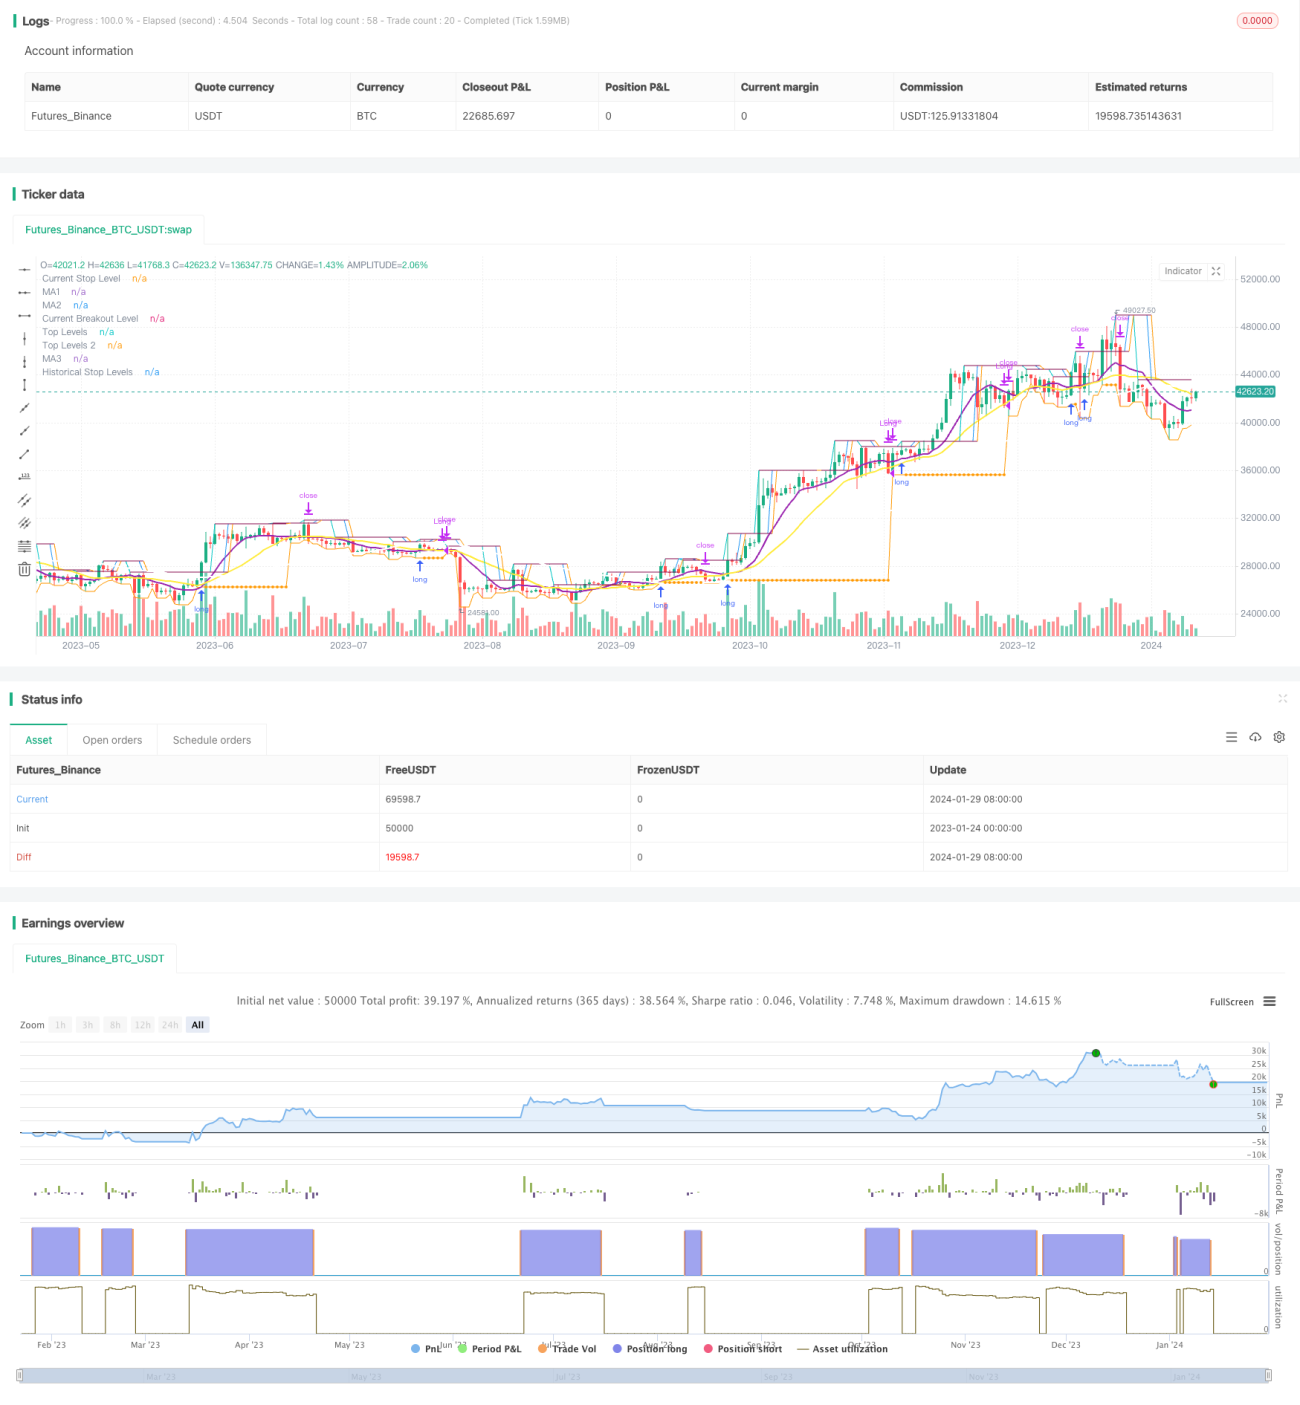
/*backtest
start: 2023-01-24 00:00:00
end: 2024-01-30 00:00:00
period: 1d
basePeriod: 1h
exchanges: [{"eid":"Futures_Binance","currency":"BTC_USDT"}]
*/

// This source code is subject to the terms of the Mozilla Public License 2.0 at https://mozilla.org/MPL/2.0/
// © millerrh

// The intent of this strategy is to buy breakouts with a tight stop on smaller timeframes in the direction of the longer term trend.- 1