بولنگر+RSI دوہری حکمت عملی (صرف طویل) v1.2

حکمت عملی کا نام
Bollinger + RSI ڈبل ملٹی ہیڈ حکمت عملی
حکمت عملی کا جائزہ
اس حکمت عملی میں بلین لائن اشارے اور آر ایس آئی اشارے کا مجموعہ استعمال کیا گیا ہے۔ دونوں نے بیک وقت اوور سیل سگنل ظاہر کرتے ہوئے زیادہ پوزیشنیں کھڑی کیں۔ دونوں نے بیک وقت اوور خرید سگنل ظاہر کرتے ہوئے کم پوزیشنیں کھڑی کیں۔ ایک ہی اشارے کے مقابلے میں ، یہ ٹریڈنگ سگنل کی زیادہ قابل اعتماد تصدیق کرتا ہے اور جھوٹے سگنل سے بچتا ہے۔
تیسرا، حکمت عملی
- RSI اشارے کا استعمال کرتے ہوئے اوور خریدنے اور اوور فروخت کرنے کا اندازہ لگانا
- RSI 50 سے نیچے oversold سمجھا جاتا ہے
- RSI 50 سے زیادہ زیادہ خرید سمجھا جاتا ہے
- برلن لائن کا استعمال کرتے ہوئے غیر معمولی قیمتوں کا تعین
- نیچے کی قیمتوں کو اوور سیل سمجھا جاتا ہے
- ٹرینوں کی قیمتوں میں اضافے کو اوور بائی کہا جاتا ہے
- جب RSI اور برلن لائن ایک ساتھ اوور سیل سگنل دکھا رہے ہوں تو زیادہ پوزیشن بنائیں
- RSI 50 سے نیچے
- قیمت لائن بلین لائن سے نیچے ریل
- جب RSI اور برلن لائن ایک ہی وقت میں اوورلوڈ سگنل دکھاتے ہیں تو ، فلیٹ پوزیشن
- RSI 50 سے اوپر
- برلن لائن سے زیادہ قیمت کی لائن پر ریل
چار، حکمت عملی کے فوائد
- دونوں اشارے کا امتزاج ، سگنل زیادہ قابل اعتماد ، جعلی سگنل سے بچنے کے لئے
- صرف ایک ہی پوزیشن قائم کریں ، منطق کو آسان بنائیں ، تجارت کا خطرہ کم کریں
پانچواں، حکمت عملی کے خطرات اور حل
- برن لائن پیرامیٹرز کی غلط ترتیب ، اوپر اور نیچے کی حدود بہت وسیع ہیں ، جس سے غلط تجارت کا خطرہ بڑھ جاتا ہے
- برن لائن پیرامیٹرز کو بہتر بنائیں ، برن لائن کے دورانیے اور معیاری فرق کو مناسب طریقے سے ترتیب دیں
- RSI پیرامیٹرز کی غلط ترتیب ، اوور بیئر اوور سیل فیصلے کا معیار غلط ، غلط تجارت کے خطرے میں اضافہ
- آر ایس آئی پیرامیٹرز کو بہتر بنائیں ، آر ایس آئی سائیکل کو ایڈجسٹ کریں ، اوورلوڈ اوور سیل معیار کو مناسب طریقے سے ترتیب دیں
- جب رجحانات نہیں ہوتے ہیں تو راون کا اثر کم ہوتا ہے
- رجحان سازی اشارے کے ساتھ مل کر، ہلچل سے بچنے کے لئے آپریشن
6۔ حکمت عملی کو بہتر بنانے کی سمت
- برن لائن اور آر ایس آئی پیرامیٹرز کی ترتیبات کو بہتر بنائیں
- نقصان کی روک تھام میں اضافہ
- MACD جیسے رجحان ساز اشارے کے ساتھ مل کر
- مختصر اور لمبی لائنوں کو جوڑنے کا فیصلہ
VII
اس حکمت عملی میں بلین لائن اور آر ایس آئی دونوں اشارے کے فوائد کو جوڑ دیا گیا ہے ، دونوں نے بیک وقت اوور بُو اوور سیل سگنل ظاہر کرتے ہوئے تجارت کی ، جس سے ایک ہی اشارے سے پیدا ہونے والے جھوٹے سگنل سے بچنے کے لئے سگنل کی درستگی میں اضافہ ہوا۔ پچھلے ورژن کے مقابلے میں ، صرف کثیر پوزیشن قائم کرنے سے ، تجارت کا خطرہ کم ہوتا ہے۔ اس کے بعد اس حکمت عملی کو پیرامیٹرز کی اصلاح ، اسٹاپ نقصان کے طریقہ کار اور رجحان سازی اشارے کے ساتھ جوڑنے کے ذریعہ بہتر بنایا جاسکتا ہے ، تاکہ یہ مختلف مارکیٹ کے حالات کے لئے موزوں ہو۔
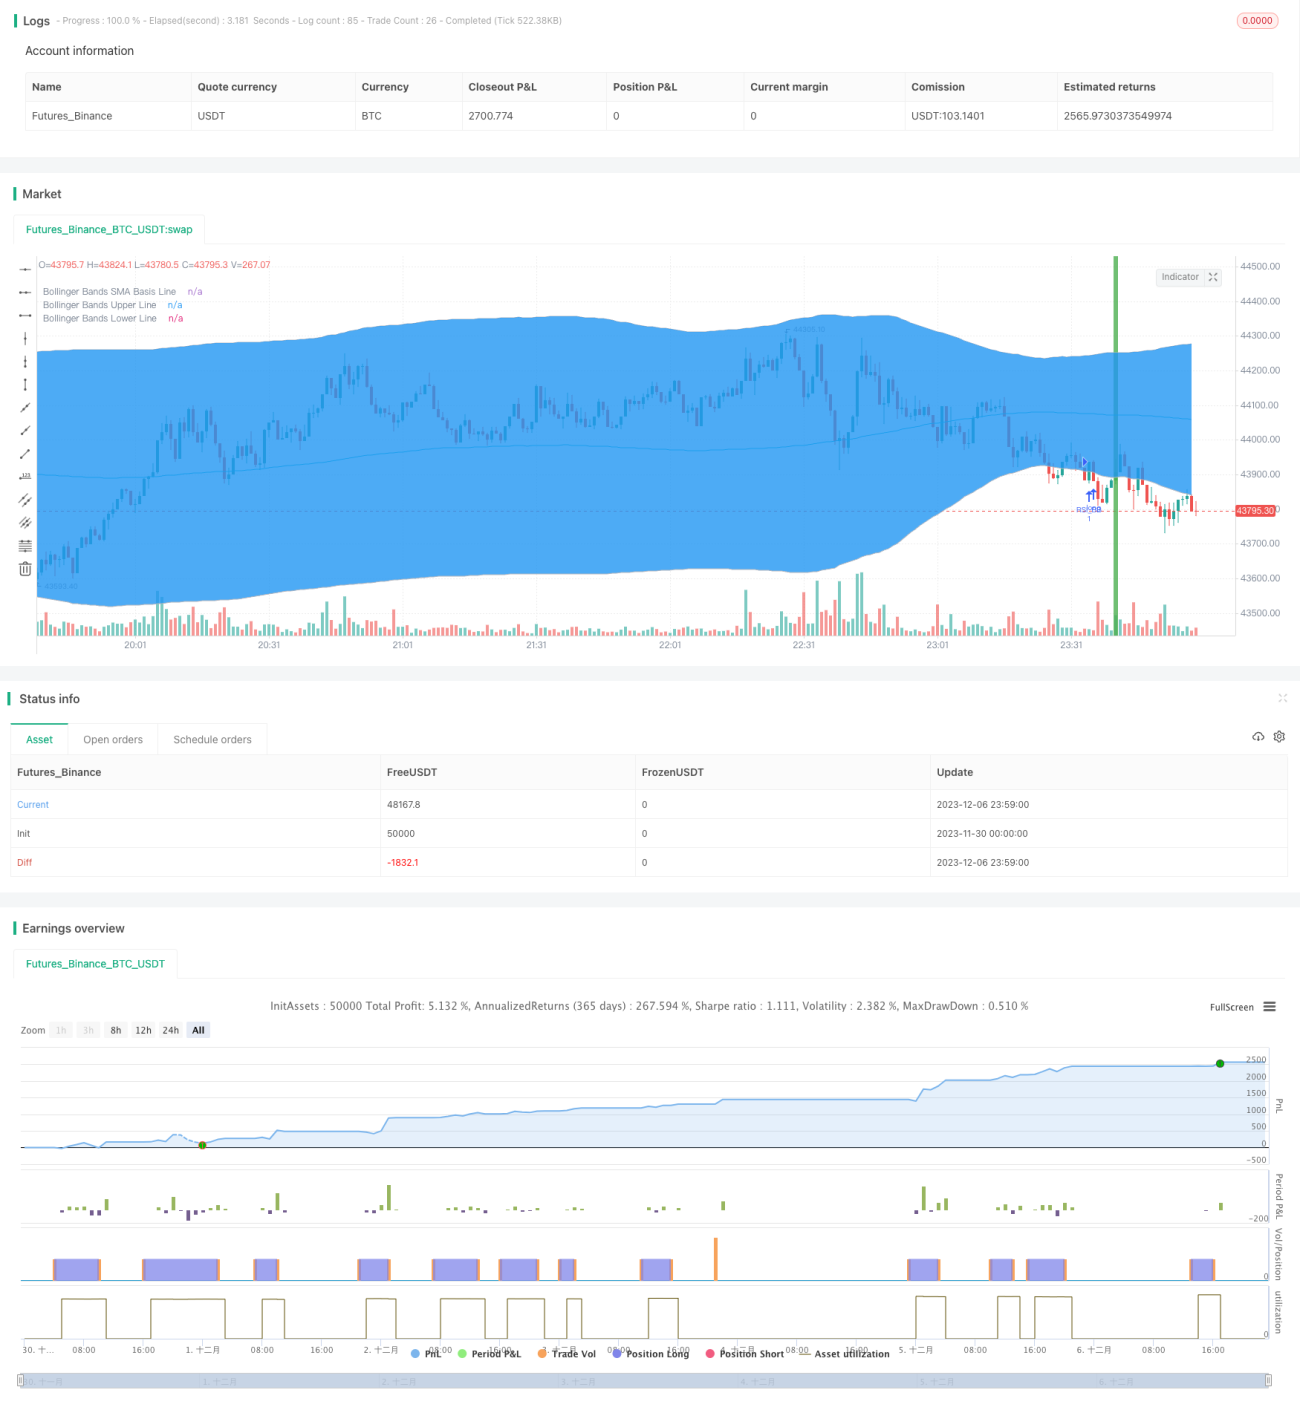
/*backtest
start: 2023-11-30 00:00:00
end: 2023-12-07 00:00:00
period: 1m
basePeriod: 1m
exchanges: [{"eid":"Futures_Binance","currency":"BTC_USDT"}]
*/

//@version=3
strategy("Bollinger + RSI, Double Strategy Long-Only (by ChartArt) v1.2", shorttitle="CA_-_RSI_Bol_Strat_1.2", overlay=true)

// ChartArt's RSI + Bollinger Bands, Double Strategy UPDATE: Long-Only- 1